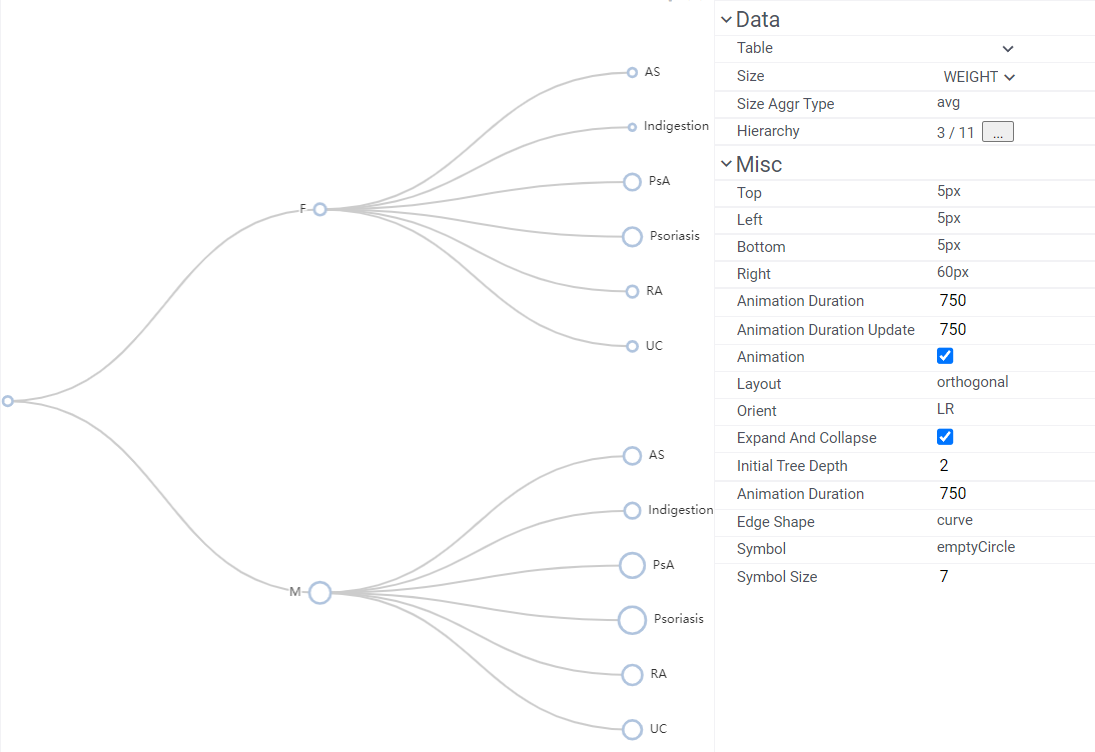
TreeViewer is used to visualize hierarchical data. The chart builds a tree structure with up to three levels for a given dataset. The columns are selected based on a number of categories in them. To change the order of columns, add new levels to the initial hierarchy or remove the existing ones, edit the hierarchy property.
The chart responds to data filters and rows selection. The only difference with the native viewers behavior is that the selection of rows in TreeViewer has limited interaction. The selection works on clicks with applied modifier keys (Shift adds to the selection, Ctrl toggles the selected state, see more in the wiki); while a regular click on a node is reserved for expanding or collapsing branches of the tree.
In the viewer properties, you can adjust marker settings, change a tree layout, or toggle certain behaviors, such as animation, expanding or collapsing nodes, etc.
Package: Charts v1.0.0
Documentation: TreeViewer
Demo dataset: demographics
2 Likes
This is fantastic, and I see so many use cases for it! Would it also be possible to add size-coding by number of rows that belong to a node?
The size-coding feature is on its way, so yes, this will be available soon.
1 Like
Looks great!
The chart builds a tree structure with up to three levels for a given dataset
I wonder why are we restricting it to three levels only?
It’s the initial tree depth, we aren’t restricting the number of levels (the hierarchy property provides for that, it’s stated above about adding/removing levels). So, if we add a viewer via the user interface, the chart will pick up to three categorical columns; if we add it programmatically with, say, five columns (or change hierarchy in the existing viewer to such values), it will expand the first three levels, but the tree leaves will be hidden, as the last two levels are collapsed. There’s also an initial depth parameter, which can be used as a shortcut to immediately expand the whole tree (value -1) or collapse it after a certain level (0 corresponds to the root, 1 to the next level, and so on).