Hello,
Is it possible to define a new continuous colour palette?
For an example one that resembles the traffic colours.
Thanks,
Bill
Hello,
Is it possible to define a new continuous colour palette?
For an example one that resembles the traffic colours.
Thanks,
Bill
Hi Bill,
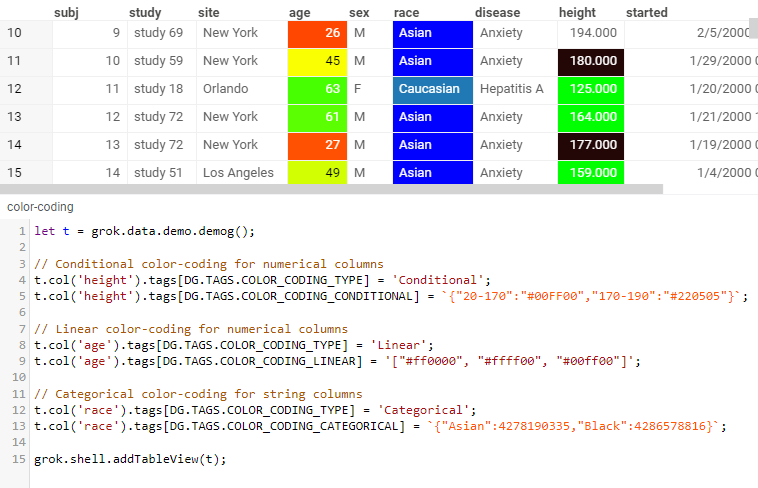
It is possible to define a new palette for the column, but at the moment this could only be done programmatically, like that:
t.col('age').tags[DG.TAGS.COLOR_CODING_TYPE] = 'Linear'; t.col('age').tags[DG.TAGS.COLOR_CODING_LINEAR] = '["#ff0000", "#ffff00", "#00ff00"]';
A working example is available here: https://public.datagrok.ai/js/samples/grid/color-coding/color-coding
We are planning on exposing this feature via the user interface as well.
Hi,
Thanks for your respose!
I forgot to mention that my questions was related to the plots (for example scatter plots).
Would this approach work also in redefining a scatterplot’s colour palette?
Best,
Bill
Yes, all plots automatically pick up colors associated with the corresponding column.
Thanks Andrew! It works indeed