Dear community,
I wonder if there is a sunburst viewer available in DG and how to enable it if so. I checked in our instance but couldn’t find it in the usual viewers. If so, could you help me understand how to use it and also if there is any documentation available?
Thanks !
Hello, Nikolaus!
Yes, there is a sunburst viewer available in Datagrok, it is stored in the Charts package. Here is the link to the viewer demo: https://public.datagrok.ai/p/Laykdimon278.SunburstViewerDemo_1.
Also, you can use it on your own dataset by clicking on the Viewers icon at the top of the platform and then selecting the Sunburst viewer.
1 Like
Thanks! I tried to use it in one of our instances by adding the viewer but I seem to be not able to get it to work there. Also, I tried to understand how to use it in your demo but didnt get veyr far. When I tried to read the docs I get this 
Any chance you can maybe share some more details? Thanks!
Can you please share more details about your problems with starting the viewer on one of your instances? If there is a problem, we would fix it.
For clarity I filmed a short video on how to start and use the sunburst viewer on the demo dataset, it would be attached below.
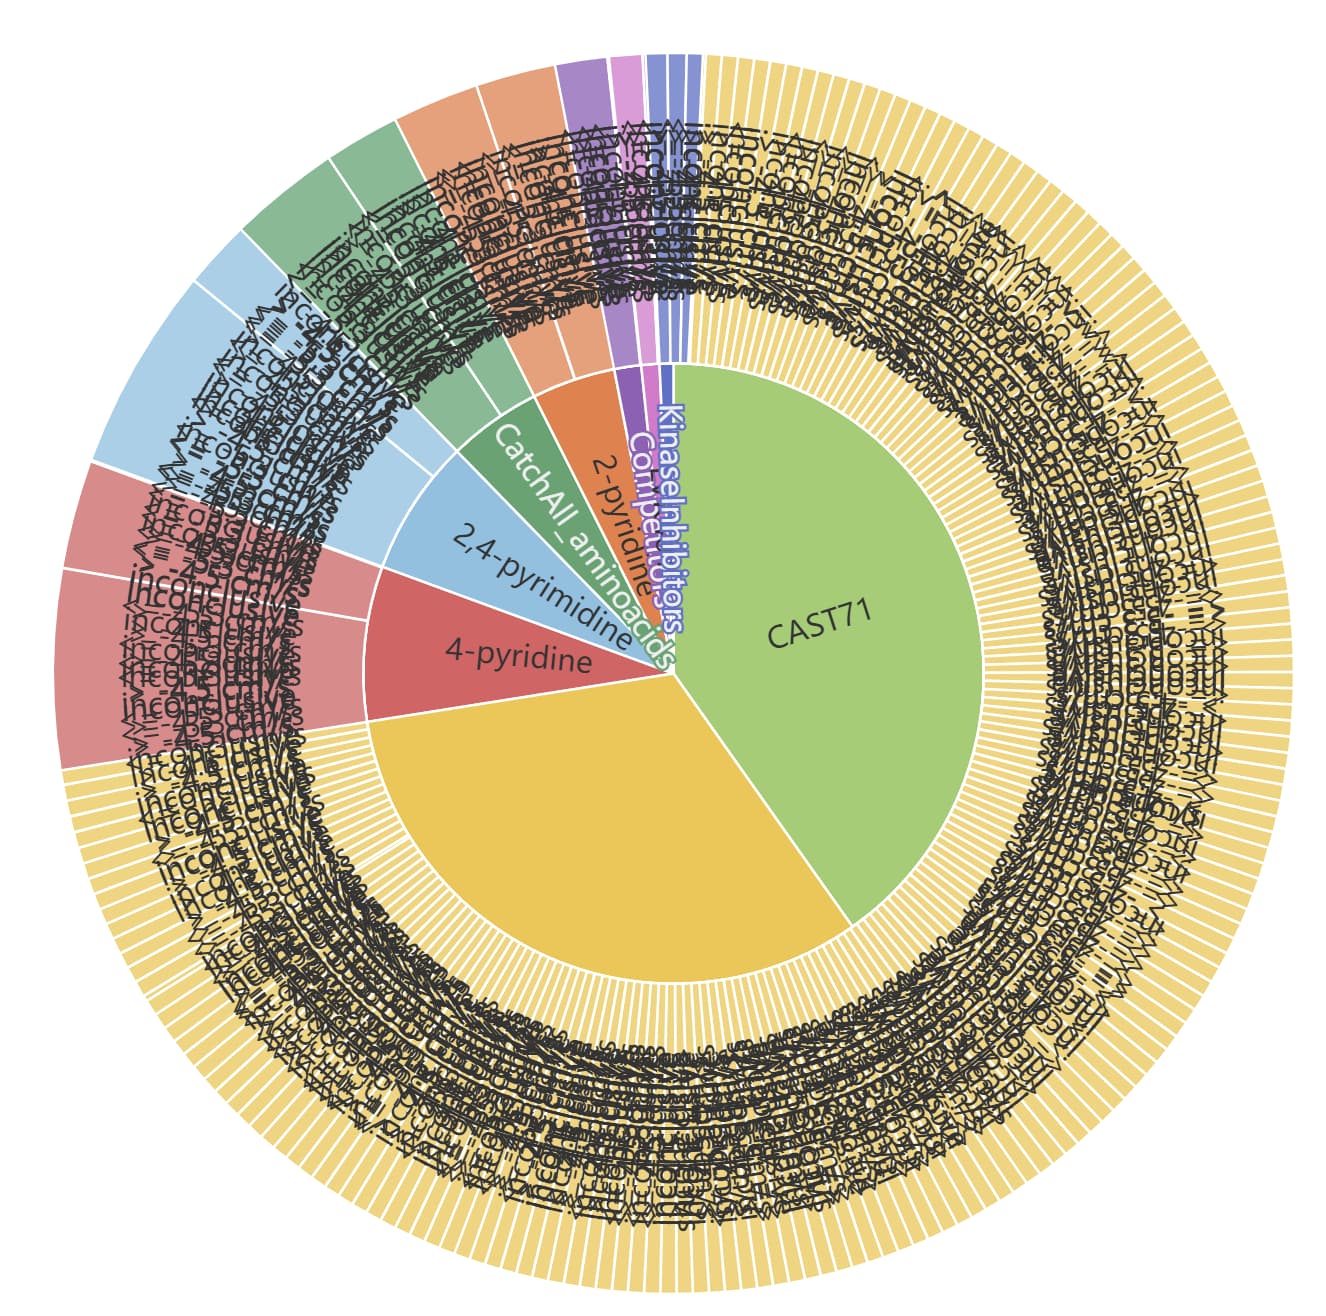
Hi there - after an update of the Chart plugin (1.0.18) on our server things seem to behave much better wrt setting things up. However, when using the viewer I see some strange behaviour. It seems as if the 2nd level classes are not aggregated. So the most inner class looks good but the first “ring out” has tons of individual classes displayed despite the fact that there are actually only 3 classes available in that 2nd ring.
Hello, Nikolaus!
Thanks for contacting, we will fix the wrong behaviour of Sunburst viewer
Can you please provide more information what steps to do to reproduce the problem? It would really help us fixing the problem.
1 Like
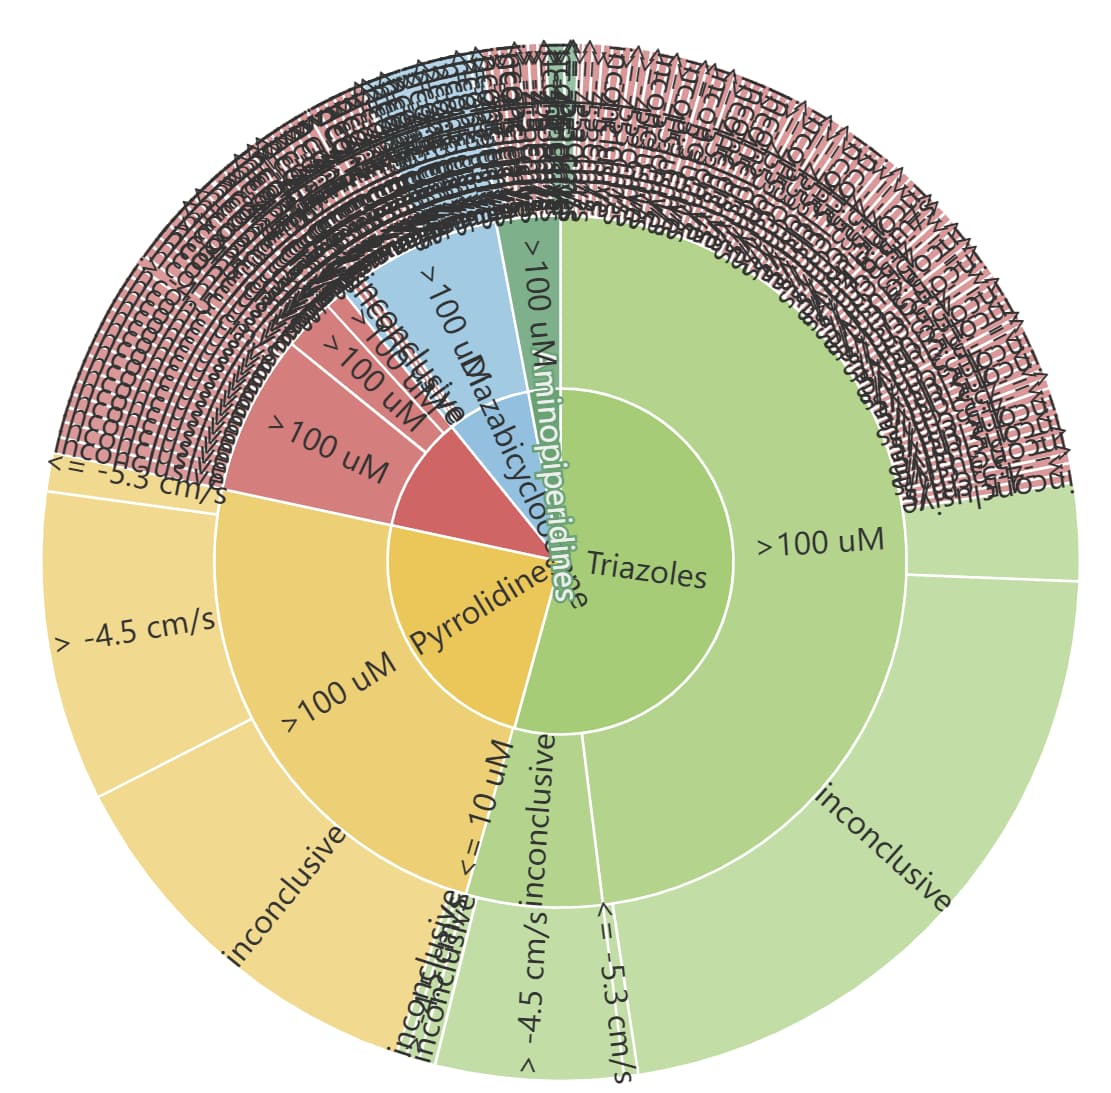
Sure - I cannot do it with the dataset I used above but if you use the SPGI dataset and then first select the “Primary Series Name”, then the “pH6.8 solubility classification” and then the “PAMPA classification” you get to this picture which seems to be more or less the same problem.
Thanks a lot again for your information.
We’ll definitely deal with the problem. Wish you a nice day!
1 Like
@nikolaus.stiefl.novartis.com
Hello, Nikolaus!
Documentation on Sunburst viewer is now available at https://datagrok.ai/help/visualize/viewers/sunburst.
Also, we are already working on improving the viewer and adding new functionality, which will be available in newer versions of the Charts package