Hi there,
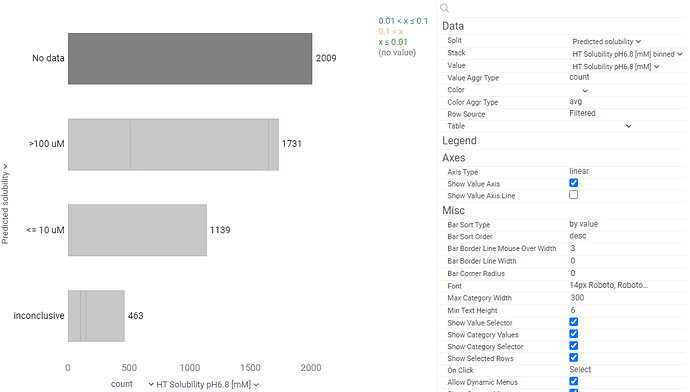
I created a Bar chart, using the “Stack” feature; I want the color to reflect the categories defined in the “Stack”, however the “Color” selector doesn’t list categorical (string) fields, only numerical fields. Did I overlook something? Thanks!
Hello Gregori 
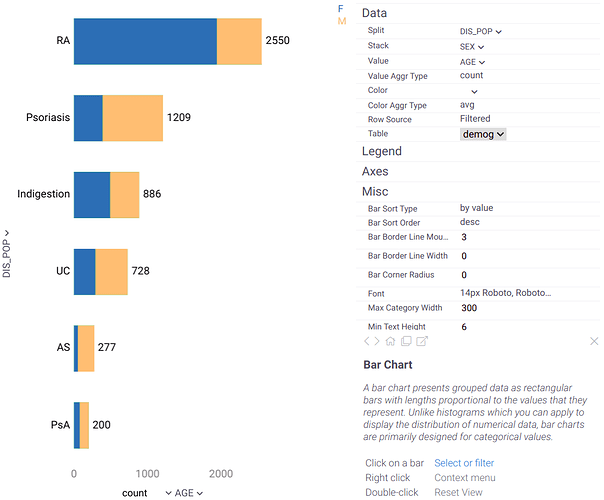
I think the Stack option itself implements color-coding by the selected column, so you don’t need to specify Color for that. This is how it looks on DG’s dev instance. Is it the same for you?
Actually I found the right setting 

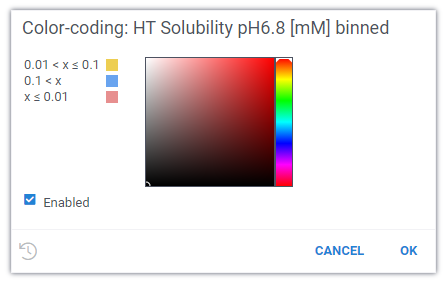
What is the API shortcut to define the colors and “enable” the color-coding?
It should have picked the standard colors automatically (when you enabled Stack), and judging from the legend on the right, it tried, so it looks more like a bug to me.
“Stack” is for producing stacked bar charts (multiple inner bars inside a bar chart). Inner bars get automatically color-coded.
“Color” is for color-coding bars based on the numerical column and aggregation function. When “color” is specified, it overrides the “stacked” color, so use these two properties together with caution - it is not completely useless (you still see the borders on your picture), but it’s definitely harder to interpret.
Perhaps we should name them better, I see how this can be confusing.
Hi Andrew,
In my first screenshot you can see that I haven’t specified the “Color” field, but still I don’t get the bars colored as expected. Is this the expected behavior? How to turn on (“Enable”) the coloring through the console?
Gregori, could you please try selecting a column without null values for Stack and check if default colors appear? I think stacked bars just don’t react well on nulls.
Indeed Diana, but it’s not only null values causing the problem: empty strings show the same behavior. Would be good to have a fix 
We will definitely fix this, thanks 
Oh, now I see it. Thanks for reporting it - this actually was a nasty bug. We’ve just fixed it.

