Charts: Timelines

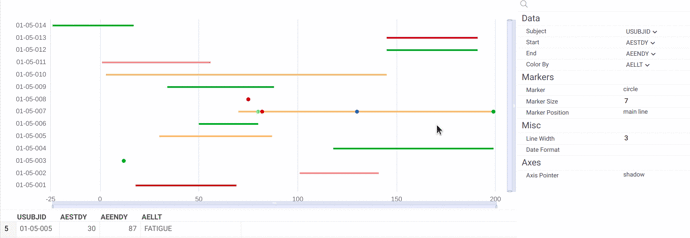
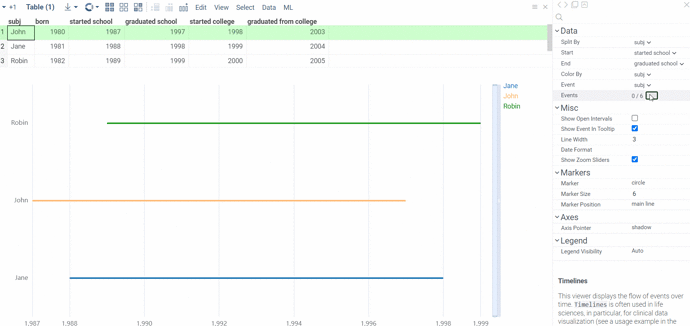
The platform supports Timelines viewer, which displays the flow of events over time. It is often used in life sciences, for instance, for clinical data visualization. This is why the viewer understands the SDTM vocabulary and automatically sets start and end selectors to the corresponding columns.

The first version has a number of other features, such as zoom sliders, marker settings, and automatic selection of the corresponding rows in the dataset. You can try this viewer on dev.datagrok.ai.
Package: Charts
Documentation: Timelines

2 Likes

Charts v0.1.3 Updates

  • Timelines: ability to define multiple “Events” columns #618
    The new feature allows using multiple dataframe columns as the source of events. These event sources are independent, so choosing the “Start” and “End” columns is not necessary (these two columns are assigned by default, but can be set to null in the chart properties). The column-defined events are rendered as markers, with each column value representing one starting point. When property “Show Open Intervals” is enabled, these events are shown as lines to the right border of the X axis.

  • Timelines: setting “Color by” to empty results in an exception #617
    Setting “Color by” propterty to null now follows the standard viewer behavior and applies the uniform coloring to the visualization. The legend is not displayed when there is no column to color by. When the user selects a categorical column for coloring, the legend is displayed according to the “Legend Visibility” mode.

  • Timelines: the X axis won’t adjust to data minimum if it is greater than zero #635
    An issue with the X axis not adjusting to the data minimum if it is greater than zero has been resolved. Now the minimum value for X is based on the chart data in all cases.

2 Likes