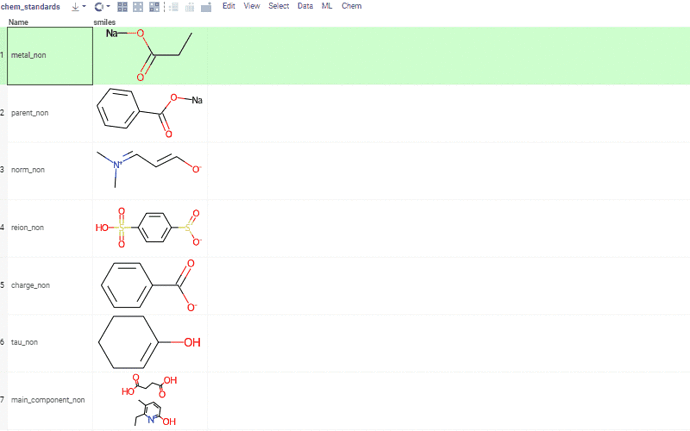
This is a follow up on a feature currently in design purposed to dropping incompatible coordinates of molecules.
In the current Chem version 0.8.18, we’ve implemented coordinates regeneration covering a variety of cases.
One may want to drop the given coordinates and just render the molecule through smiles. But if there is such a scaffold which has coordinates incompatible with rdkit coordinate system (done by hand, gotten from a non-rdkit util, etc.), it first needs to be converted (through smiles) to the “default coordinates” of RDKit, then it may still be a scaffold to which other molecules may be aligned to.
This is what the regenerate-coords tag is for. If it is set on a column, the molecule, if it isn’t in smiles, is passed through cleaning, where the existing coords are dropped and the clean rdkit coords are regenerated, rendered and be used for alignment, if requested (with a scaffold-col tag). In addition, if the regenerate-coords is set on a scaffold column, then the column being aligned to this column is also set to regenerate-coords to make a proper match to RDKit’s ones. In the result, all alignments in all cases are visually correct.
We’ve noticed though that, in case the hand-made coordinates are given for a scaffold, there is a strong reason for having them be aligned in that original way for chemists. In such case, setting the regenerate-coords on such scaffold column may be just a fallback, but not a permanent solution (without fixing the actual coordinates by hand).
However, it isn’t clear how to simplify the scheme in case the scaffold is given in a coordinate system incompatible to the molecule column being aligned:
If we drop the coordinate data from the molecule after it is aligned, we’d loose the visual alignment
If we render the molecule being aligned with dropping coordinate data (using only smiles), the alignment may be distorted in the same way it was without dropping coordinate data, as the source scaffold is still in the alien coordinate system
If we render the scaffold column simply by dropping coordinate data (using only smiles), we could not align to it, that is why we recreate the “default rdkit coords” for it before it is used to align to
We’ve updated Chem to 0.9.0. This update includes:
Scaffold highlight with alignment when filtering by a substructure
Scaffold highlight with alignment when aligning to a scaffold via a column property panel “Chem”
For a given column, selecting a column with a source scaffold to align to, both visually via a column property panel “RDKit Settings”, and programmatically through a scaffold-col tag
Optional highlighting for the scaffold specified in a scaffold column of the above
An option to regenerate coordinates of a column, which comes in handy when the coordinate system of these column’s entries isn’t native to RDKit and thus hindering alignments. This option “forgets” the coordinates provided for the MolBlock molecule, and regenerates them based on RDKit. Available both visually via a column property panel “RDKit Settings”, and programmatically through a regenerate-coords tag
Per package properties, an option to choose the molecule renderer between JS-RDKit and OpenChemLib (reload Datagrok to make a new choice into effect)
The recent version of JS-RDKit 2021.03 with stability and rendering improvements
We’ve also improved the molecules’ renders cache, which makes both horizontal and vertical scrolling 13-19 times faster and, therefore, visually smoother. Let’s compare them against previously published Chem Benchmark results:
Horizontal scrolling (20 random molecules, 100 times): 526 ms (earlier: 9679 ms)
Vertical scrolling (20 random molecules, 100 times): 1324 ms (earlier: 19562 ms)
Recently introduced value comparators could of course be used for cheminformatics purposes as well. In the picture below, a trivial comparator based on the SMILES length is used to roughly order the molecules by complexity. All visualizations pick it up automatically.
“Save as SDF” function is now exposed in the main “save as” menu. At the moment it simply exports the first structure column and all other columns as properties, but we will add options as well:
Out-of-the-box, you can paste SMILES, MOLBLOCK, and InChi keys into the input field, and the sketcher
automatically translates it to a structure. In addition to that, you can make sketcher understand
other structure notations (such as from your company’s internal database of structures) by registering
a function annotated in a special way. The following example provides support for Chembl. The important
tags are:
--meta.role: converter: indicates that such a function serves as a value converter
--meta.inputRegexp: (CHEMBL[0-9]+): RegExp that is evaluated to check if this function
is applicable to the user input. The captured group (in this case the whole input) is then
passed to this function as a parameter.
--output: string smiles { semType: Molecule }: should return string with the semType Molecule
--name: chemblIdToSmiles
--meta.role: converter
--meta.inputRegexp: (CHEMBL[0-9]+)
--connection: Chembl
--input: string id = CHEMBL1185
--output: string smiles { semType: Molecule }
select canonical_smiles from compound_structures s
join molecule_dictionary d on s.molregno = d.molregno
where d.chembl_id = @id
This is how it looks in action:
A molecule query does not have to be a database query, any function
will do. For instance, InChi query is implemented as a Python script.
New functionality is available in Similarity/Diversity search.
Information from any column of initial dataset can now be added to molecules panes. To to that go to context panel and select columns from Molecule Properties field. You can add as many columns as you need.
Please note that color coding applied to initial dataframe is saved in molecule panes. Color coding can be applied to background or text.
This new feature significantly simplifies visual data analysis. All required information becomes available at once in molecule panes. You do not need to scroll initial grid to exact column and cell to get the data.
Dimensionality reduction algorithms can now be customized to suit specific needs. This technique is particularly useful in Chemical space and Activity cliffs functions when visualizing high-dimensional molecule data on a 2D scatter plot. To achieve this, UMAP and t-SNE are two available options.
To customize parameters, simply click on the Settings icon near the algorithm selection field, which will expand the list of parameters. Each algorithm has its own set of adjustable parameters, accompanied by a tooltip providing more detailed information.
Scaffold Tree is a tool for the generation and analysis of molecular scaffold networks and trees that is now available in Chem. This tool has the capability to process large sets of input molecules and provides users with the ability to perform hierarchy generation either automatically or manually.
To access Scaffold Tree, simply open a dataset with molecules and then select Chem | Analyze Structure | Scaffold Tree from the top menu. Once you’ve opened the tool, you can start generating your Scaffold Tree. The initial tree is automatically generated, but you also have the option to sketch the tree manually or modify the automatically generated one.
In addition, with this tool you can:
filter the molecules exclusively in your dataset by a particular scaffold;
highlight rows matching a particular scaffold;
save Scaffold Tree as a part of the layout, or as part of the dashboard;
load a previously saved tree.
Overall, Scaffold Tree is an incredibly powerful tool for anyone working in the fields of chemistry and biology. Its user-friendly interface and advanced capabilities make it a valuable addition to any researcher’s toolkit.
We are excited to announce the initial release of the ADMETox plugin that predicts ADMET (absorption, distribution, metabolism, excretion, and toxicity) properties for chemical structures.
The binary files of all the models have been obtained from the publicly accessible ADMETlab repository and are open-source.
With ADMETox, you can easily:
obtain predictions for either a single structure and for the entire column;
get a well-designed and easily navigable forms for every structure in your dataset;
get a deeper understanding of what each of values mean with the help of our tooltips and color coding tools.
To evaluate predictions for a single molecule, click on it and expand the ADME/Tox pane in the Context Panel.
To calculate properties for the entire column, go to the top menu and select Chem | ADME/Tox | Calculations. The corresponding predictions will be added to the table as numerical columns, so you can visualize or filter them using the built-in tools.
To see detailed information on a structure in a well-formed and color-coded form, select Chem | ADME/Tox | Add form… from the top menu. The form gets updated as you move between rows.
With ADMETox, we believe that evaluating molecule properties has never been easier or more accessible. We hope this package will assist in advancing drug development and research efforts!