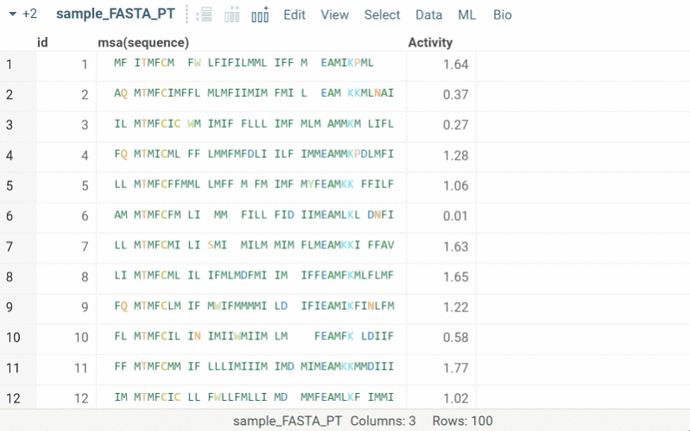
Datagrok visualizes multiple sequence alignment by the traditional sequence Logo viewer.
You can select sequences in your dataset containing the particular monomer at the position just by clicking it in the viewer, and vice versa, the viewer draws a Logo on the filtered sequences. Besides, you can switch between relative frequencies and entropy scale and customize the look by other properties. All filter tools of Datagrok apply to the viewer.
To launch the viewer, from the top menu, select Bio | Composition Analysis .
