Dear Datagrok team,
I would like to inquire about the behavior of Curve functionality.
In order to show the reproducibility of an assay experiments, I have stored multiple curve data sets in the same color within a single cell. I wrote the sample data in the bottom of this post for your reference.
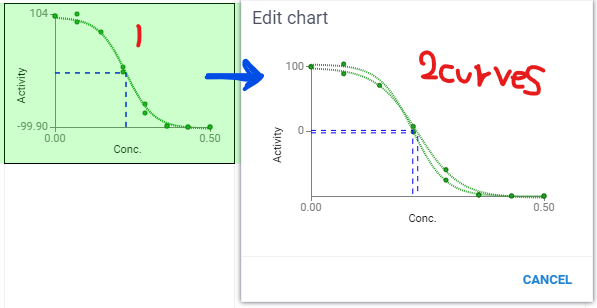
I’ve noticed that in a cell in grid, only one curve is visible by default. However, when I either double-click the cell or use the MultiCurveViewer, both curves become visible.
Is it possible to modify the JSON configuration to display both curves simultaneously within the grid cell? I wonder if you colud point out in case I set incorrect parameters in JSON.
Best regards,
Kosuke
{"series": [{"showCurveConfidenceInterval": false, "points": [{"x": "0.000200", "y": "100"}, {"x": "0.000600", "y": "88.9"}, {"x": "0.00200", "y": "71.0"}, {"x": "0.00620", "y": "7.57"}, {"x": "0.0186", "y": "-59.2"}, {"x": "0.0560", "y": "-98.0"}, {"x": "0.168", "y": "-99.8"}, {"x": "0.500", "y": "-99.9"}], "fitFunction": "sigmoid", "pointColor": "#2ca02c", "fitLineColor": "#2ca02c", "errorModel": "combined", "lineStyle": "dotted", "droplines": ["IC50"]}, {"showCurveConfidenceInterval": false, "points": [{"x": "0.000200", "y": "99.5"}, {"x": "0.000599", "y": "104"}, {"x": "0.00619", "y": "-0.634"}, {"x": "0.0186", "y": "-75.3"}, {"x": "0.0559", "y": "-98.4"}, {"x": "0.168", "y": "-99.8"}, {"x": "0.500", "y": "-99.9"}], "fitFunction": "sigmoid", "pointColor": "#2ca02c", "fitLineColor": "#2ca02c", "errorModel": "combined", "lineStyle": "dotted", "droplines": ["IC50"]}], "chartOptions": {"showStatistics": [], "xAxisName": "Conc.", "yAxisName": "Activity", "logX": true, "logY": false, "title": "Dose-Response curves"}}