Hi,
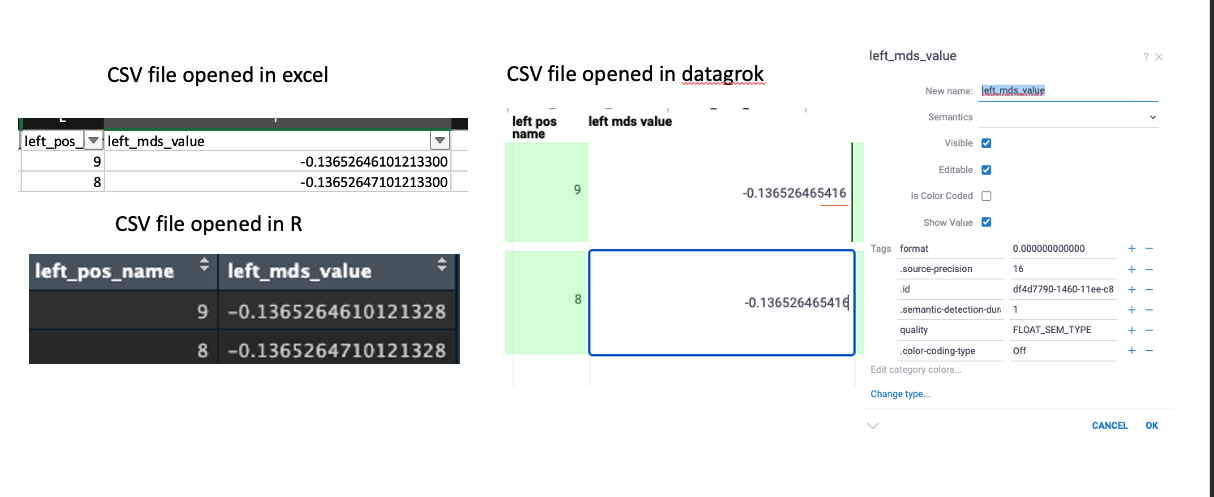
I am working on some extreme small numbers using datagrok web interface. I found that the numbers are not identical to its original .csv file when interpreted by datagrok. To be specific, the 9th digits after the decimal point seems to be incorrectly interpreted even though I set the column property source precision to be 16 digits. On the other hand, when I opened the file in excel or R they seemed to agree to about 15th digits after the decimal point. I’ve included a screenshot of the problem. I am wondering whether there is any setting I would need to do to increase the precision? Thank you!
Best,
Ling
Hi, Ling
Thank you for your feedback. The behavior you described is a bug. We will strive to fix it as soon as possible.
Hi Ling, currently in Datagrok floating point numbers are represented as 32-bit floats, which indeed guarantees the precision of about 8 significant digits (integers and big integers are stored differently, so your long identifiers are safe :)). This is the expected behavior. This allows us to store twice as much numerical data in memory, and also improves the performance of the system. For vast majority of use cases, this is enough for representing either measured or calculated values, taking into account the inherent imprecision related to measurements; you also won’t notice any difference in any visualizations.
We used to have 64-bit option as well, and it would not be very hard for us to bring it back (periodically this question comes up). But I wonder how important that sort of precision is for your use case, or were you simply worrying that numbers show differently from how they were represented in CSV?
Best,
Andrew
Hi Andrew,
Thanks for the kind explanation!
In my specific use cases, I would need 10-12 digits after the decimal point to distinguish between the two closely related molecules. The number represents the projection of molecules in the low dimensional space. The range of numbers is about -1 to 1, so maybe I could multiply each number by 1e14 and round them into big integer type? Would the numbers automatically be recognized as big integers (not integers) when loaded into the table?
Along with this question, I am also interested in testing whether the visualization would be affected by the precision. It seems that the 3D scatter plot has a certain limit that we could zoom in (probably not enough resolution to distinguish the two closely related molecule?), but the 2D scatter plot has unlimited spaces to zoom in. Is this the expected behaviour? Would you mind advising the resolution/precision of the 3D vs 2D scatter plot?
Thank you!
Best,
Ling
Hi, Ling
Сonverting numbers to the big integer format should work effectively. The platform recognizes big integers, and viewers support them.
3D scatter plot lacks specific controls for the scaling you mentioned. 2D scatter plot might be more suitable for distinguishing closely related molecules.
Best regards,
Olena
Thank you for conforming this!!
Best,
Ling
Ling, indeed your use case is one of the very few cases when that sort of precision is required. We had an internal discussion about it, and it looks like we will be implementing support for Float64 sometime in the future. The idea is to make it transparent to the user, and switch to Float64 only when required (for instance, if numbers in the CSV file have many significant digits). I’ll keep you updated.
That would be amazing! Thank you for being flexible!