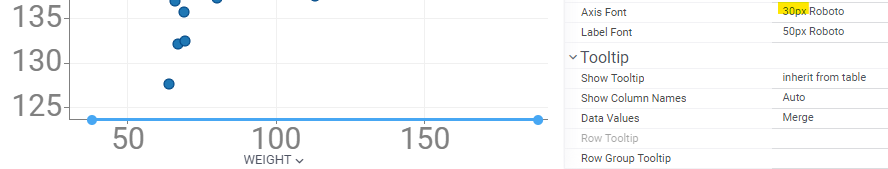
Is it possible to change the font size of X-axis value labels in a scatter plot?
I know I can modify the font type and size using Style | Axis Font, but specifically, I’d like to change the size of the X-axis property name (shown as ‘WEIGHT’ in the figure).
This would be helpful when using the plot in presentation slides.
I wonder if you could share how to do this.
@agolovko Let’s do it - and of course not only for the scatterplot, but for all viewers. I think there should be one “selectorFont” option that controls the font of all selectors on top of the viewer.
Hi, all,
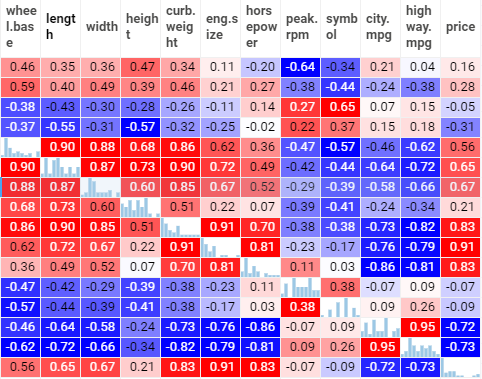
Regarding font size, I think it would be beneficial if we could adjust the text size in the correlation plot as well. I would appreciate if your plan could cover it as well.
Additionally, I have another request regarding the correlation plot besides the font size.
When the matrix size becomes large, the row information becomes difficult to view. Therefore, I believe having a feature that “freezes” the row names would make it easier to understand the data.
I would appreciate if you could consider this request as well.
Example of rather large correlation plot using demo cars data
When the matrix size becomes large, the row information becomes difficult to view. Therefore, I believe having a feature that “freezes” the row names would make it easier to understand the data.
Thank you, that’s a great suggestion!
Here is the tracking ticket:
We have added an option to adjust the text size of column and row labels in the correlation plot. This update will be included in the upcoming Datagrok 1.27.0 release.