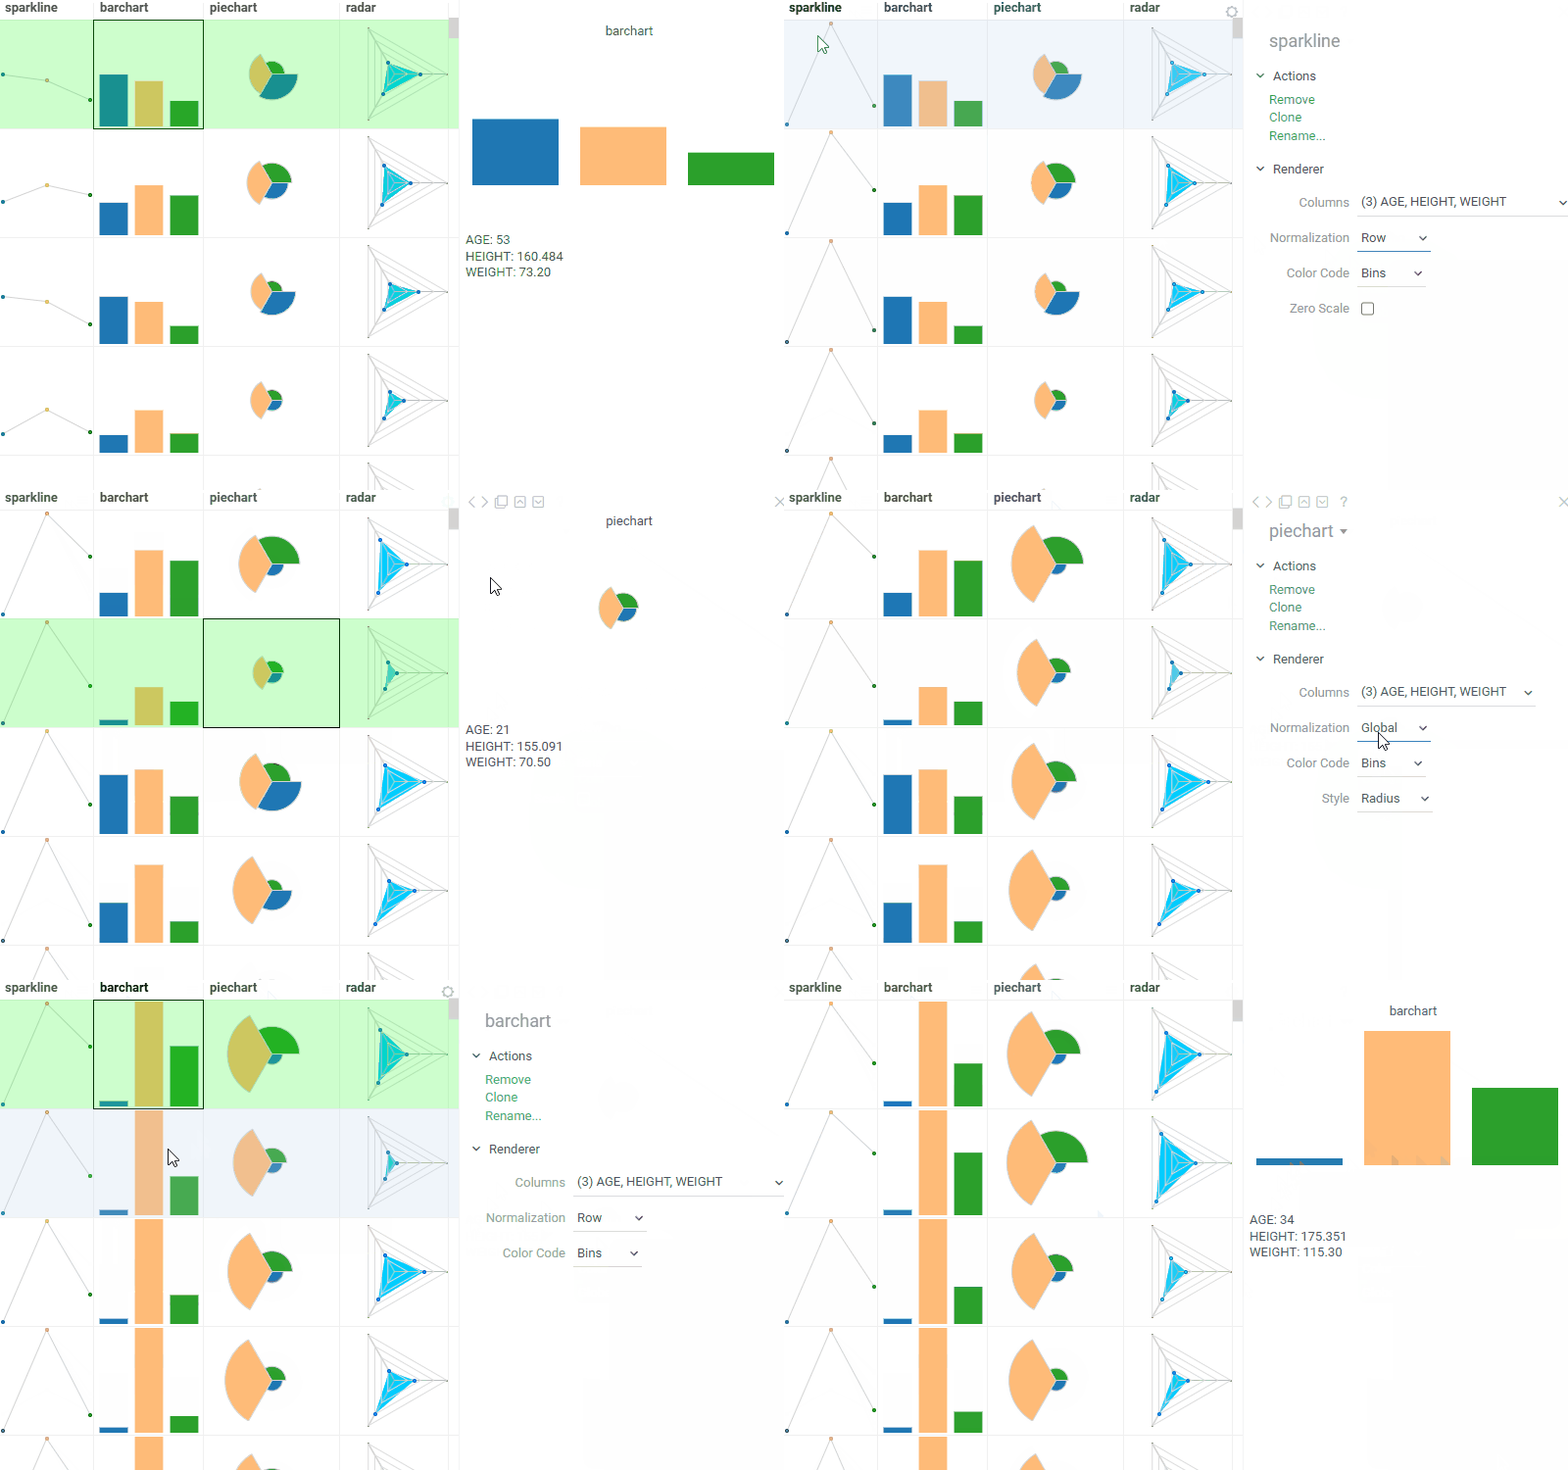
Please welcome summary columns normalization!
Sparklines (as well as bar charts, radar charts, and pie charts) now support three normalization types:
- Row: points are normalized based on row values.
- Column: points are normalized using column min/max values.
- Global: points are normalized using global min/max values.
This new feature is fully backward compatible with the old boolean globalScale property (globalScale = true maps to normalization = 'global', globalScale = false maps to normalization = 'column').
