How to make stacked bar chart

Dear Developer,

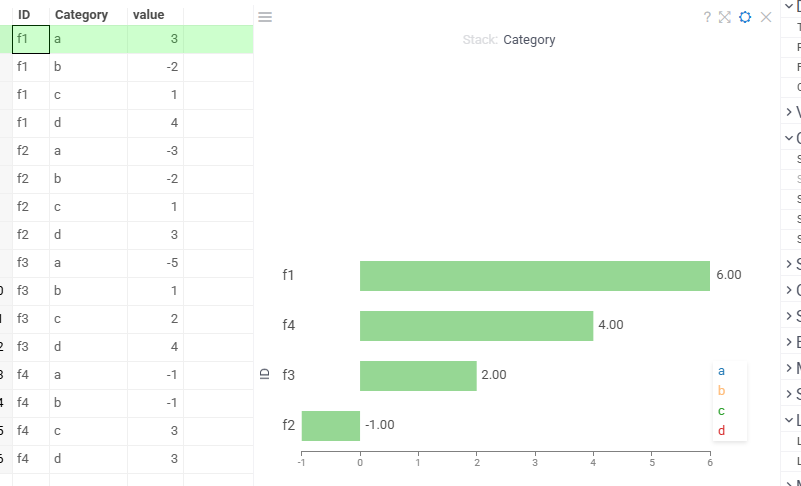
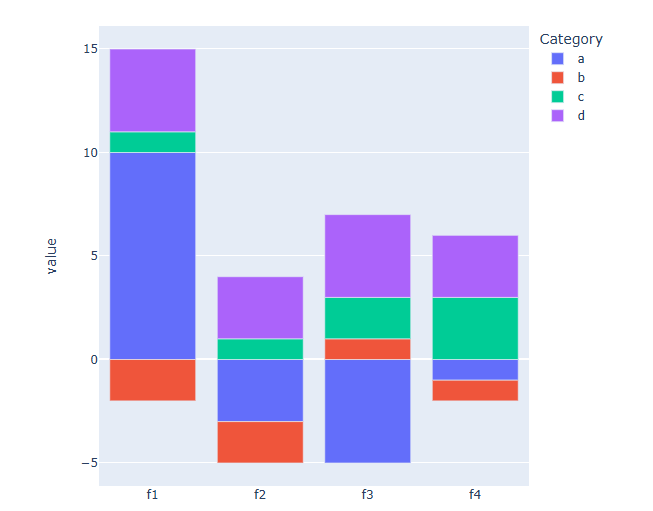
I hope everything goes well. I have a question for making bar chart of datagrok. When I tried to make bar chart with data like following, I should define aggrigate method. Then I could not stack value with categories.

ID Category value
f1 a 10
f1 b -2
f1 c 1
f1 d 4
f2 a -3
f2 b -2
f2 c 1
f2 d 3
f3 a -5
f3 b 1
f3 c 2
f3 d 4
f4 a -1
f4 b -1
f4 c 3
f4 d 3

Like this

I would like to make chart with the data stacked by category. Shown below (It made with plotly ).

Are there any way to make bar chart like this?

Any comments or suggestions are greatly appreciated.

Thanks!

1 Like

Hi Taka,
I hope you’re doing well too.
Thank you for bringing this issue to our attention. Currently, the bar chart does not support the Stack function when aggregation values include negative numbers. We are already working on resolving this issue.

Here’s the ticket for tracking progress:

Best regards,
Olena

1 Like

Hi Olena,

Thanks for your prompt reply!

It’s really useful for analysing results of fragment molecular orbital output.

https://pubs.acs.org/doi/abs/10.1021/acs.jmedchem.6b00045

Looking forward to solve the issue.

Thanks for your kind support.

Best,

Taka

1 Like