Issues with Trellis Plot

We are facing a couple of issues with the Trellis Plot (some similar issues are already reported in another post from my side):

  1. Changing viewer types is not working properly. Setting it to Scatterplot does not work at all for us
  2. It seems to have two different settings icons:
  3. Changing the data table does switch the viewer type back to Pie charts
  4. Changing the data table does not update the configuration dialog
  5. The individual plots are ignoring the trellising:

Hi Nico, thanks for reporting it. Some of the issues are definitely bugs, but others are likely not:

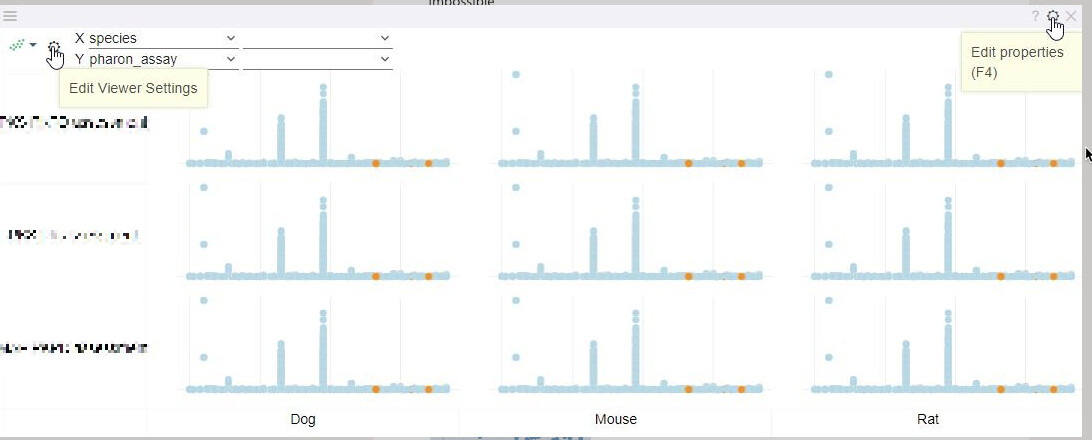
  1. ‘Edit viewer settings’ icon on the left edits the settings of the inner viewer, as opposed to editing the global trellis settings. In the future, we will combine both settings under the standard gear icon.

I see, thanks for the clarification on 2)

This has just been fixed (the fresh dev build will be available in 30 minutes). Apparently we broke it for scatter plot when we introduced the “filter by zoom” feature; all other viewers were working fine.

ok, thanks for the quick action.

Nico