Hi Team,
I have found two potential bugs about Line chart, could you please check and solve them, if necessary.
① When multiple splits are selected, the settings are lost when saving the project and reopening it. Therefore, it is necessary to reset them each time.
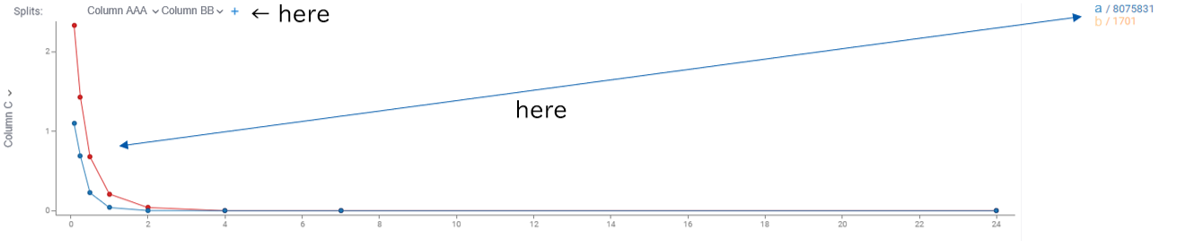
② When multiple splits are selected, the color of the line and the legend are different.
Kosuke.M
Dear Taka,
Thank you for bringing this issue to our attention.
- Could you please specify which settings are being lost upon reopening the project?
- We’ve successfully reproduced this behavior. Please be assured, we are dedicated to resolving this issue in the near future. A corresponding GitHub issue has been created to address it: GitHub issue 2782.
Best,
Olesia
Hi Olesia,
Thank you for your reply.
・The situation is as follows:
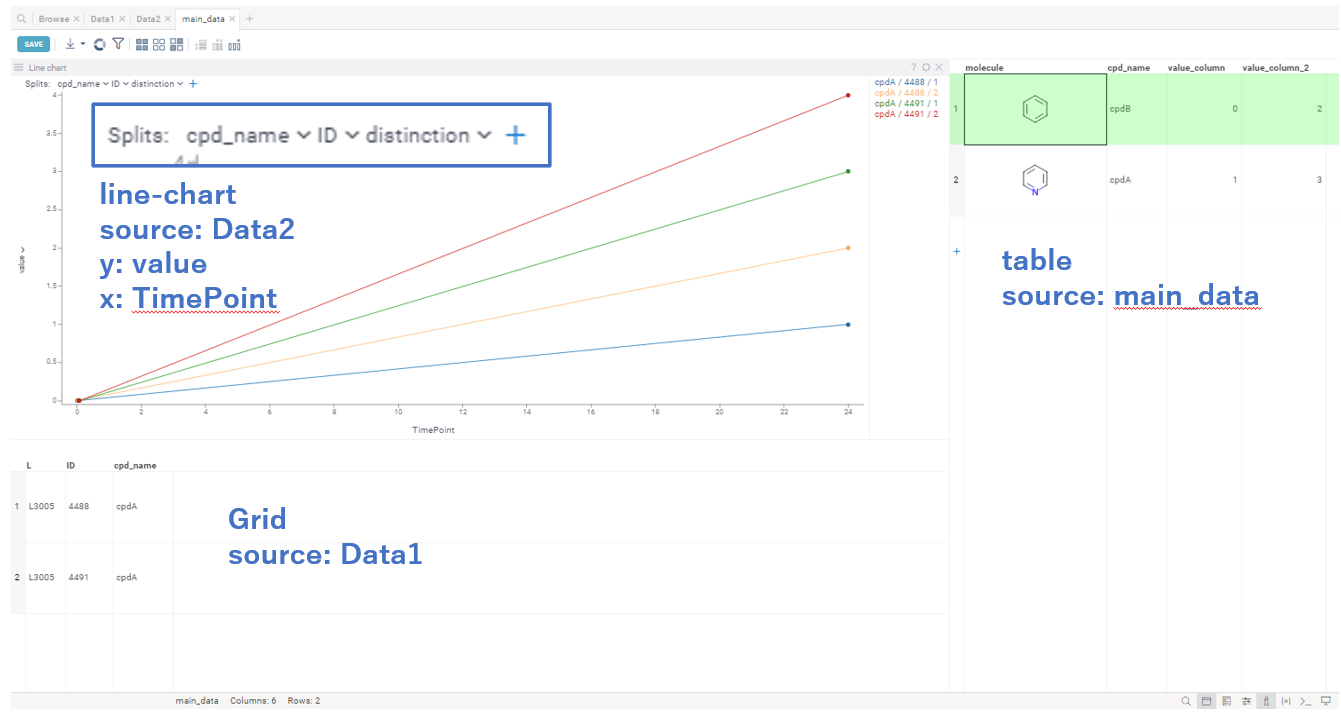
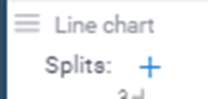
In the line chart, multiple columns are selected as splits (e.g., Column AAA & Column BB in the figure)
↓
After the analysis is completed, the project is saved
↓
When reopening the project, the settings are lost.
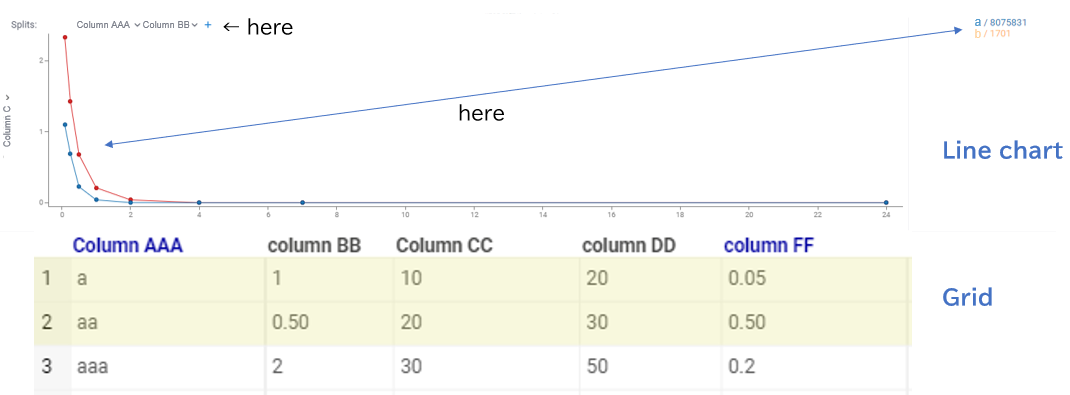
We are using the Line Chart and Grid by linked table.
The Line Chart is displayed by selecting data on the Grid.
However, this setting is lost.
Please feel free to ask if you have any questions.
Best,
Kosuke
Dear Taka,
I wasn’t able to reproduce the issue you mentioned (see attached video).
When saving the project, the selected rows are not retained. Therefore, upon reopening the project, you will need to select the rows again. This behavior is expected. However, added Splits remain present after reopening the project.
Could you please take a look at what I might have missed?
Additionally, could you provide some details:
- What platform version are you using?
- Do you save your project with datasync or without?
- Are you using *.csv or *.sdf datasets?
- What type of linking tables are you using?
- Is the line chart breaking on the main table or on a linked one?
Best,
Olesia
1 Like
Dear Taka,
Fixed problem with colors in v1.18.5. Investigating the problem with lost column settings, will inform you when it is fixed.
3 Likes
Dear Olesia,
Sorry for late to reply.
I share the additional information below.
(now, I use ver1.18.6)
-
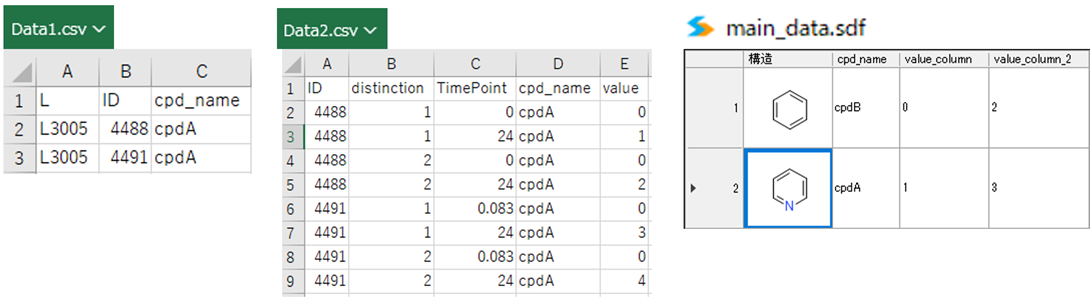
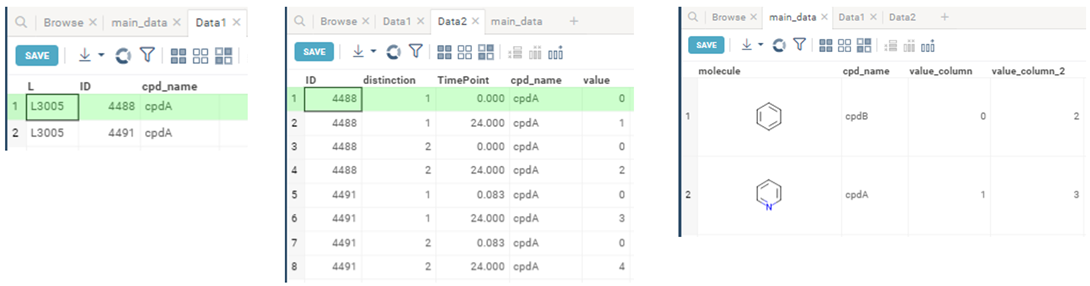
Demo-data
we save our pj with datasync and/or without, but in each case happened the problem
-
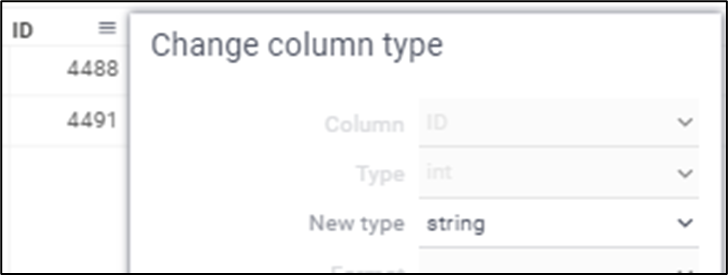
Changing (ID and distinction) column type from int to string for splits of Line chart
(cannot choose columns which the type is int)
-
Usgin Line-chart and Grid viewer.
-
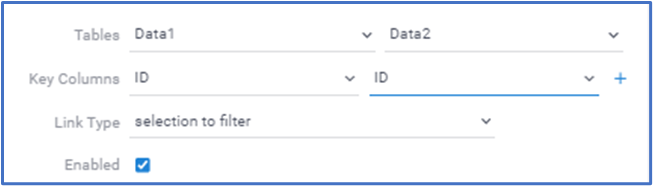
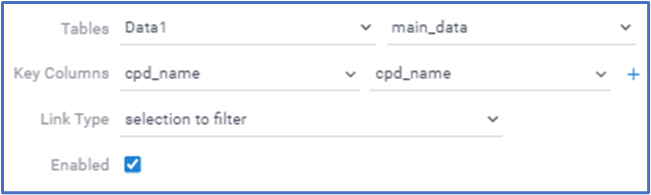
Setting Link tables
-
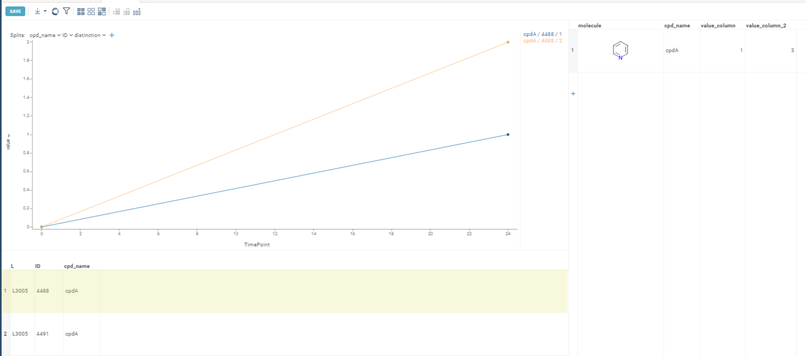
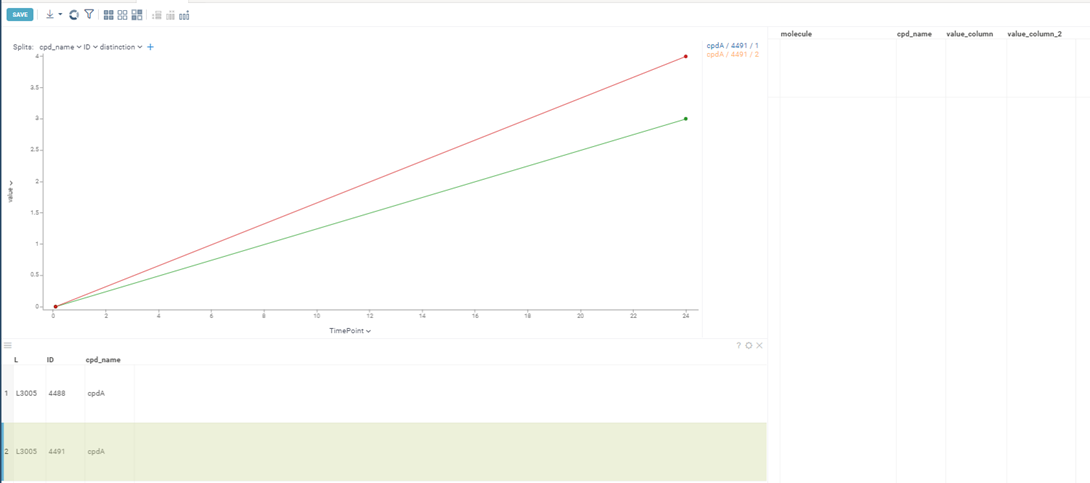
When I select the column from the top of the Table, no problem.
But, when I select the other, the color of Line and the legend are different.
Best,
Kosuke
Hi! yes, we will definitely fix this in the nearest patch.
1 Like
Hi DG team,
Thank you as always for your prompt updates and support.
I would like to share again about the bug related to the Line chart that was observed during the version 1.20 update.
When multiple splits are selected, the color of the line and the legend are different.
Best,
Kosuke
Dear Taka,
Thank you for bringing this issue to our attention.
Please be assured, we are dedicated to resolving this issue in the near future.
I’ve also created the GitHub ticket №2944 about different colors of the line and the legend when multiple splits are selected.
We will do our best to include this fixed issue into nearest 1.20.1 hotfix.
Best,
Olesia
Dear Kosuke,
We have fixed the GitHub ticket №2944 connected to different colors of the line and the legend when multiple splits are selected.
It will be included into nearest 1.20.1 hotfix and will be released in a couple of days.
Best,
Olesia
2 Likes