Hi Olesia,
Thank you for your reply.
・The situation is as follows:
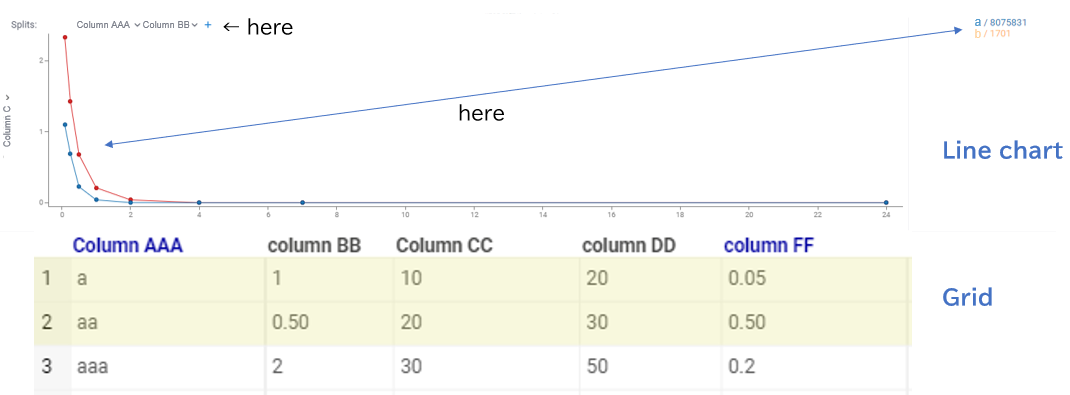
In the line chart, multiple columns are selected as splits (e.g., Column AAA & Column BB in the figure)
↓
After the analysis is completed, the project is saved
↓
When reopening the project, the settings are lost.
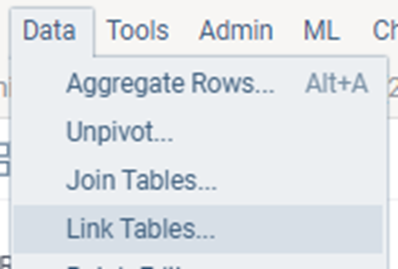
We are using the Line Chart and Grid by linked table.
The Line Chart is displayed by selecting data on the Grid.
However, this setting is lost.
Please feel free to ask if you have any questions.
Best,
Kosuke