Hi everyone!
We started development of a new package “Bio” to process macromolecules entities and their monomer constituents.
1 Like
Sequence renderer has been added to Bio.
Sequences are now automatically detected and rendered in a grid with monomers (both natural and unnatural) aligned.
2 Likes
The alignment of multiple sequences is a fundamental step in analyzing biological data. For that, we use kalign that runs in the browser thanks to Robert Aboukhalil’s biowasm. It is a powerful algorithm capable of aligning thousands of protein or nucleotide sequences.
To run multiple alignment, select Bio | MSA... from the top menu:
2 Likes
The support for HELM notation is provided.
Among the capabilities are rendering in the spreadsheet, calculations etc. More detailed information can be found here.
In addition, we are ready to introduce a feature that enables us to open Helm Web Editor for ’fasta’ and ’separator’ notations from the Context menu and Actions panel. The example is presented below:
2 Likes
Sequence space tool is now available in Bio package.
Datagrok allows visualizing multidimensional sequence space using a dimensionality reduction approach. Several distance-based dimensionality reduction algorithms are available, such as UMAP or t-SNE. The sequences are projected to 2D space closer if they correspond to similar structures, and farther otherwise. The tool for analyzing molecule collections is called ‘Sequence space’ and exists in the Bio package.
To launch the analysis from the top menu, select Bio | Sequence space.

2 Likes
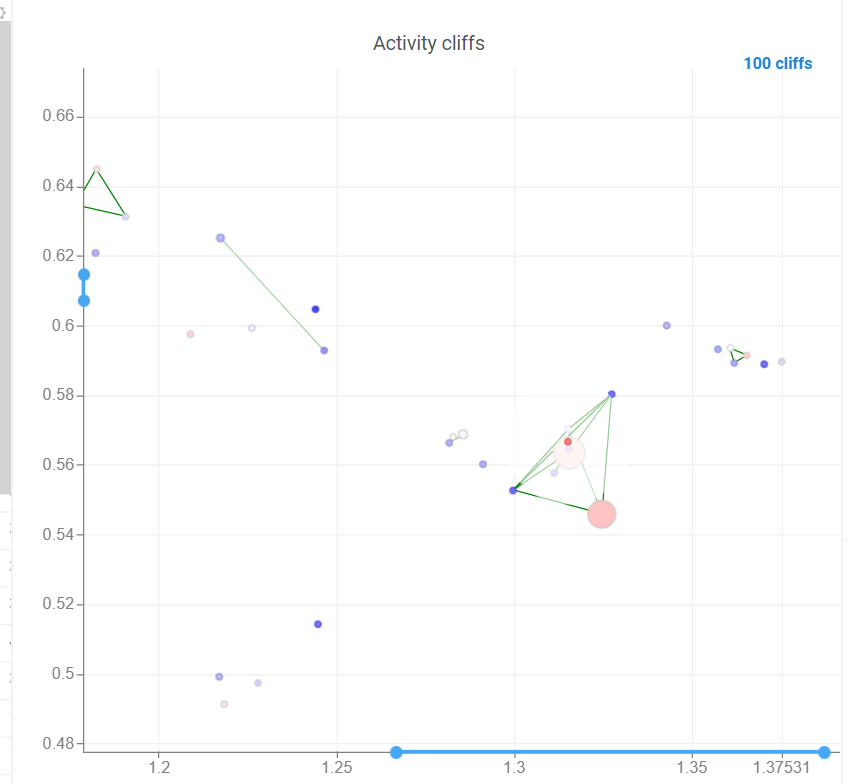
Activity cliffs analysis is available in Bio package.
Activity cliffs tool finds pairs of sequences where small changes in the sequence yield significant changes in activity or any other numerical property. open the tool from a top menu by selecting . Similarity cutoff and similarity metric are configurable. As in Sequence space, you can select from different dimensionality reduction algorithms.
To launch the analysis from the top menu, select Bio | Sequence Activity Cliffs.

After scatter plot is generated, a link with the number of the identified activity cliffs appears in the top right corner. Click on this link to open a dialog with the list of cliffs. Then, click on a particular pair to zoom in to it on a scatter plot. Hover a line to see the details on the corresponding sequences and activities.

Ctrl+click on the line to select the corresponding sequences.
Marker color corresponds to activity, marker size and line opacity correspond to the SALI parameter (similarity/activity difference relation).
3 Likes
Splitting to monomers
Splitting to monomers allows splitting aligned sequence column in multiple monomer columns. The function is available in the aligned sequence column actions in property panel.
1 Like
Comparison of monomers sequences is now available
Datagrok allows comparing the current sequence of monomers (or the reference one) with all the others in the table. In the compare mode, the identical monomers in the corresponding positions are displayed with transparency, and the different ones are highlighted.
To set options for rendering and turn On/Off the comparison of monomers sequences, on the Context Pane, expand the Sequence Renderer info panel:
- Monomer width. In short mode, only the first character of the monomer is visible, followed by … if there are more characters.
- Color code. If disabled, all monomers are displayed in black.
- Reference sequence. When defined, the renderer displays all sequences in the compare mode with the specified sequence.
- Compare with current. If enabled, the renderer considers the current sequence as a reference and compares all other sequences with it. This option is enabled by default.
3 Likes
Peptides 1.5.0 is out!
This release addressed performance issues with the package, introduced a couple of useful features such as Invariant Map color-coding and Logo Summary Table customization as well as bug fixes!
Performance
Some of the analyses involve heavy computation that were making the UI unresponsive. We have analyzed the bottlenecks in the package, and came up with ways to improve user experience by optimizing the algorithms and switching to calculate-when-requested model. Here are the benchmark results on 5,000 peptides:
- Mutation Cliffs - 14x speedup
- Monomer-Position statistics - 38x speedup
- Cluster statistics - 6x speedup
- Refactoring - 3x speedup (improved overall performance)
Overall the analysis starts 30 times faster now!
Invariant Map
Invariant Map can now be color-coded. Color-coding settings can be modified in viewer properties: the user can choose column to color cells based on and values aggregation function.
Logo Summary Table
Logo Summary Table now allows to change WebLogo rendering mode and members ratio. Available WebLogo rendering modes are 100% height and Entropy. The members ratio sets a minimal threshold that filters out the clusters with less members.
Settings: Include columns
Include columns allows to choose any numeric column from dataset to show in Logo Summary Table. In the future releases we plan to show such values in Monomer-Position tooltips and main dataframe view.
Bug fixes
- Fixed a bug that rendered header WebLogo at the wrong coordinates
- Fixed a bug that prevented Mutation Cliffs from rendering if the sequences are of different length
- Fixed unreadable long monomer names
Peptides 1.5.0 is already available at public.datagrok.ai!
2 Likes
Notation converter for macromolecules
Any macromolecule can be represented in different notations: HELM, FASTA, and separator (with a specified delimiter for multicharacter monomer codes). To get a new column in a specific notation, do the following steps:
- Click the hamburger menu of the column with macromolecules.
- Select Actions > Bio | Convert. A dialog opens.
- Select desired notation from the Convert to dropdown list
3 Likes
 Peptides 1.6.1 is out!
This release introduces new features and capabilities such as custom clustering and multiple views, as well as a slightly redesigned user interface and improved application stability. Let’s take a closer look at the new features.
 Custom Clustering
Custom Clustering is a feature in the Logo Summary Table (LST) that allows users to create a new cluster from the current selection and filters. The new cluster is immediately added to the end of the LST. For custom clusters, LST calculates statistics such as members, mean difference, p-value, and builds plots such as WebLogo and Histogram.
It’s super easy to create a new cluster: simply select the monomer-position pairs or existing clusters you want to include in your new cluster and click the plus sign in the upper right corner of the LST. You can also customize the name of the new cluster in the viewer properties.
Users can also delete the created clusters by selecting the cluster to delete and clicking the trash can icon.
 Multiple Views
Multiple Views allows you to create a separate view for a subset of your data. New views are created from the visible selected rows (visible means rows are not filtered out) and contain only the dataframe of the selected rows and the Logo Summary Table viewer.
To create a new view, simply select the monomer-position pairs or clusters in the LST and click the New View button at the top of the screen. The new view will immediately appear on your screen. You can customize the name of the view by changing the text box to the left of the New View button.
Note: each view must have a unique name.
Peptides 1.6.1 is already available on public.datagrok.ai!
4 Likes
It is now possible to run docking results in Datagrok and display them for both target and ligands with the help of NglViewer. The positions of the ligand have to be preliminarily computed and opened as a table.
To add NglViewer:
- On the menu ribbon, click the Add viewer icon.
- In the dialog, select NglViewer.
To update position of the ligand in the viewer, click the appropriate row in the grid, as shown in the gif.
3 Likes
![]() Peptides 1.8.0 has been released!
Peptides 1.8.0 has been released!
We’ve been working hard to make improvements and add new features to the Peptides package. Let’s see what’s new in this release.
![]() Dendrogram integration
Dendrogram integration
One of the most exciting new features is the integration with the Dendrogram package, which adds a dendrogram viewer to the datagrok platform. To make it work, we first calculate the Levenshtein distance matrix for each sequence pair and perform hierarchical clustering based on the distance matrix. From there, we build the dendrogram based on the resulting tree.
Please note that there are some limitations to this integration at the moment. For example, users cannot currently choose other distance metrics such as Jaro-Winkler and Manhattan, and it’s impossible to interrupt the calculation of distance matrix. We are working on addressing these issues and they will be fixed in future releases.
![]() Misc
Misc
Aside from the dendrogram integration, we’ve also made other improvements in this version. We’ve reworked our cluster calculations, unifying the methods to ensure consistent and reproducible results across different cluster statistics views (such as Logo Summary Table rows, cluster tooltip, and distribution panel).
We love hearing from our community and welcome your feedback. Please let us know what you would like to see in future releases.
You can try out Peptides 1.8.0 now at public.datagrok.ai. Thank you for your support and we hope you enjoy the new release!
2 Likes
Hierarchical clustering for Macromolecules
Hierarchical clustering from Dendrogram package now supports macromolecule columns, containing DNA, RNA or protein sequences in fasta or separator notation.
Users can also cluster Macromolecule columns alongside with numeric columns. In such cases, Distance matrices will be calculated for both, normalized and added together
Distance functions:
For different types of sequences, different distance functions are used. If the macromolecule column is detected to be MSA, Hamming distance will be used to save time. For DNA and RNA sequences, very fast and optimized version of Levenstein distance will be used. For protein sequences, Needleman-Wunsch distance with BLOSUM62 substitution matrix will be used.
Optimizations
Dendrogram generation makes use of web-worker multithreading for distance matrix calculation and web-assembly for clustering. For distance matrix, a single Array is used representing top triangle of the actual matrix, which allows to save half space. Calculation of distance matrix is parallelized between multiple web-workers and depending on user’s CPU, speeds up distance calculations around 10 times.
The clustering algorithm is written in C++ and compiled to web-assembly. This makes the algorithm extremely fast and efficient. All these optimizations can be clearly demonstrated by the function’s speed of execution.
3 Likes
Dear valued members of the community,
We are excited to announce the recent launch of Datagrok’s Multiple Sequence Alignment (MSA) functionality, now available on our platform.
Our MSA feature uses two powerful algorithms, kalign and PepSeA, to provide fast and precise alignments for both FASTA and HELM sequences. Kalign is a well-known algorithm in bioinformatics for its speed and accuracy, while PepSeA is an advanced algorithm designed specifically for aligning complex structures in HELM notation.
With Datagrok’s MSA functionality, you can upload sequences and obtain accurate alignments in seconds. You can also visualize aligned sequences, explore conserved regions, and export the results in various formats for further analysis.
To access the MSA feature, follow these simple steps:
- Open the dataset with sequences in Datagrok.
- Select Bio > MSA from the menu ribbon to open the MSA dialog. The sequences column and format is detected automatically.
- Set the MSA parameters such as gap extend and gap open penalties and the alignment method.
- Optionally, to perform MSA only for the sequences grouped by cluster, select the clusters column.
- Once the parameters have been set, click “Ok” to run the MSA and obtain the results.
Try Multiple Sequence Alignment now at public.datagrok.ai!
As usual, we welcome any feedback from the community and are excited to hear from you.
Thank you for your continued support.
2 Likes
Helm cell renderer now displays the structure of monomers for linear, branched, or circular monomers and even heterogeneous compounds in the tooltip. Just hover the mouse over a monomer rendered in the cell.
3 Likes
Sequence space and Chemical space now support more than 20K rows through UMAP dimensionality reduction.
In previous implementation, size limit was due to constructed distance matrix size, which for 20K rows ended up being about 1.5GB. In the latest update, we now support Sparse matrix calculation, which enables the dimensionality reduction to run on much more data. In case where number of rows is more than 20K, Users will be prompted to provide a threshold for sparce matrix calculation. In essence, only such pairs that have similarity higher then the threshold will be included in the sparse distance matrix and thereby reducing its memory footprint dramatically. All other pairs will be considered to have similarity of 0.
The UMAP algorithm in use has been optimized for this specific use case, and can now calculate embeddings for 50K macromolecules in under 2 minutes.
To aid interactivity and better experience, the process of dimensionality reduction has been made progressive, meaning that users will see the progress of embedding optimizations on scatter plot as they are calculated on each step.
2 Likes
New distance function for macromolecular sequences based on chemical distances between monomers.
Sequence space now supports distance function that is based on chemical distances of monomers.
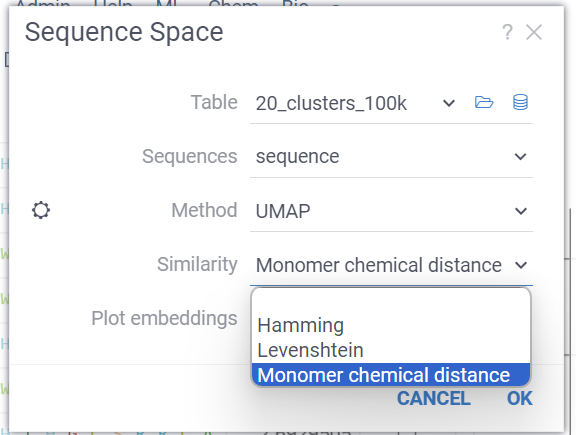
First, the dataset is analyzed and a set of all unique monomers is created. Next, we create a substitution matrix, based on the chemical distances between each pair of monomers. These distances are calculated using the chemical fingerprints of each molecule. This matrix is used as weights for each substitution in distance calculation.
Optimizations:
Distance calculations are running in multiple parallel web workers, without duplication of same pair calculations. This enables the platform to calculate all pair distances for 50K sequences (1.25 billion distance calculations) in under 20 seconds.
2 Likes
Datagrok displays docking results (pdbqt)
The BiostructureViewer package version 2.0.15 now supports .pdbqt files for importing ligand poses and targets in the pdbqt format. Additionally, it can now handle Molecule3D data in PDB format as ligands.
To use it, double-click a .pdbqt file from Shares, and it will be processed as follows:
- If the .pdbqt file contains only ligand poses, Datagrok imports them into the data frame and prompts you to open the docking target structure in a dialog.
- If the .pdbqt file contains only structural data (without any MODEL record), Datagrok will open the Biostructure viewer with this data, as it did previously.
4 Likes