A frequent feedback we are getting from the users, is that the viewer configuration is overwhelming and showing a lot of less important settings on the same visual level as the key settings.
Any change to adjust this and having less frequently used settings - like Colors or Margins - in a collapsed “advanced” section?
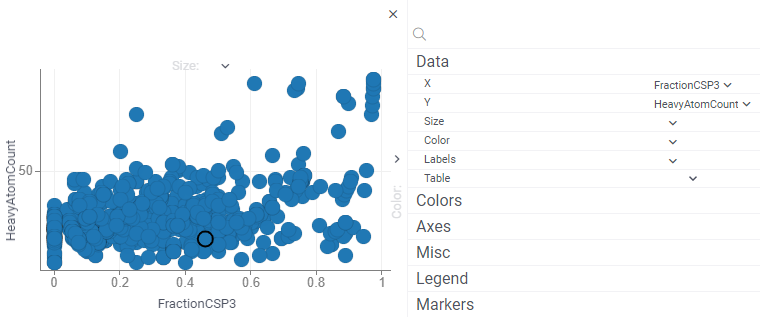
Thanks for the feedback! We’ve grouped the properties exactly for that reason, with the most important properties residing in the “Data” section on top. Just to make sure I don’t misinterpret, are you suggesting to simply collapse groups other than Data by default, just like in the picture? This can be done quickly and I like the idea (we will also remember the collapsed state so that it won’t be frustrating for people frequently using other options)
We’ve just implemented this feature. The collapsed/expanded state is also remembered per user, per category (local storage used for persistence). I think it makes more sense to not take into account viewer type. For instance, if you expand the “Colors” section on the scatter plot, it will also be expanded for the histogram as well.