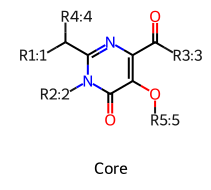
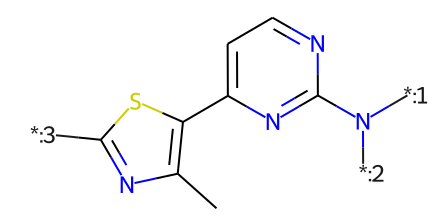
Hi, I would like to know if there is an option to see overview between core structure and side chains in R-group analysis.
It would be helpful to show the correspondence between specified core structures and assigned number for side chains when generating multiple R-groups generated in R-group analysis. Sometimes, it becomes difficult to understand when the number of R-groups exceeds, for example, more than five. Having a visualization feature that shows the specified core structure and the positioning of the assigned number of R-groups would be useful.
If you have any questions or comments, please let me know.
Best regards,
Kosuke
Dear Kosuke! Thank you for the feedback.
I assume, we can add this functionality in the next version of Chem package (but need to check if rdkit library is capable of such functionality).
I propose to add an additional option (a checkbox, for instance) for user to choose whether to show the column with the core or not. So along with R group columns you will have a column with the specified core with the R-group position numbers. What do you think? Will it be sufficient for your purposes?
1 Like
There would be several options to show core structures with attachement points and their labels. I found some, and I posted for your information.
So along with R group columns you will have a column with the specified core with the R-group position numbers.
I think it is reasonable way to keep core structure information. On the other hand, core structure will be refered again and again when considering R-group analysis results, so popping up bigger image would be more user friendly. For example, after executing R-group analysis, R-group columns are added on the grid and new window showing core structure with attachement points pops up.
If you need more information to clarify please let me know.
Best regards,
Kosuke
1 Like
Thank you for the idea, Kosuke. Will also discuss it with our UI designer to find the most user friedly way to show the structure.
2 Likes

