Hello!
Here are some features that would be great to see in a Datagrok:
- Viewer-filter. In other words, a filter that is applied to 1 particular viewer via a convenient interface. Additionally, an ability to change selection in a presentation mode, like in a simple filter.
- View-filter. At this moment, different filters in 1 project are synchronized even if it located in different pages (views). Those different pages can’t be filtered differently.
- Ability to change display number format in a chart, not in a whole dataset. For instance, remove decimal places in 1 particular chart.
- Ability to make a bar chart vertical. Line chart with chart type «Stacked bar chart» has many restrictions.
- A chart type that allows you to display only one numeric value. This chart type allow you to answer a question «what is a total revenue in my dataset» and many others.
- A way to customize the chart title (font, size, color).
- Ability to rank data in charts. At this moment, you can just sort the data in charts. It would be nice to be able to choose that I only want to display the Top 5 / Bottom 5 (max 5 / min 5 ) values on the chart.
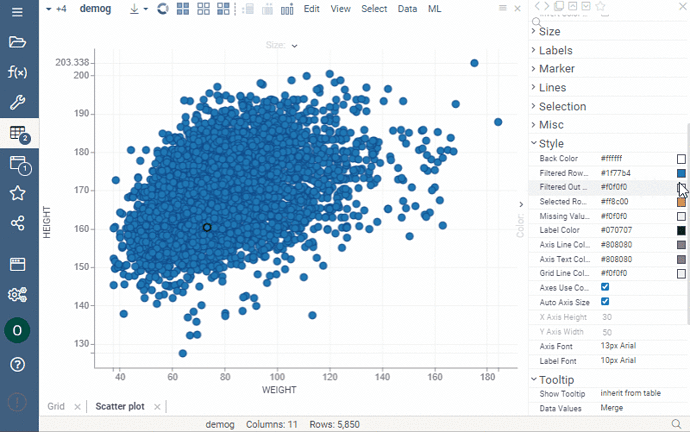
- Ability to change the color by manually entering the hexadecimal color code (in the format #ffffff).
