When I create two scatterplots and use one for the row selection and the other for showing the selected ones only (using the Row Source = Selected), the axis does not scale to the subset of selected data, even though I checked “Axes Follow Filter”:
Just found another, but probably related issue.
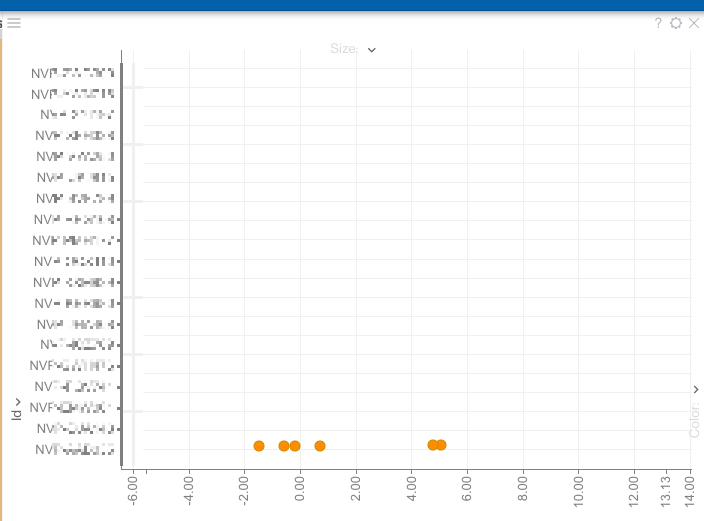
When plotting categorical data on an axis, the axis does not update when I filter data out, but still shows all categories:
While writing the previous post, I realized that “Axis follow filter” is actually linking the zoom slider of the plot to the slider of the filter, but it’s not really adjusting the axis (both axis, X & Y) to the range of visible data.
Do you think that this “Axis follow filter” option could instead adjust (both axis) to the visible range of data, instead of following the range slider in the filter?
I feel like these should be two separate options, sometimes you simply want the scatter plot to reflect the exact filtering criteria (for instance when dragging a filter on a histogram), in other contexts you do want to zoom in to the points. Actually, I believe we already have these two properties axesFollowFilter and zoomAndFilter, but it appears that they don’t work well together. @aydar.akhmetov, I think we should get rid of the axesFollowFilter altogether, and introduce this as a separate mode for the zoomAndFilter property
yes, I agree, I would put that also in line with zoomAndFilter, as this is what you are effectively doing, but just in a bi-directional way.
Would you still say, that there could be a ‘new’ option, which actually scales to the visible points (even when triggered by a different row source than filtering)?
zoom to filtered points - zooms to the rectangle covering all points that pass filter. So when you filter numerical column by dragging the range slider, scatter plot viewport would “jump” sometimes (depending on the distribution of points).
zoom to ranges - zooms to the filter conditions (smooth zooming in the case above).