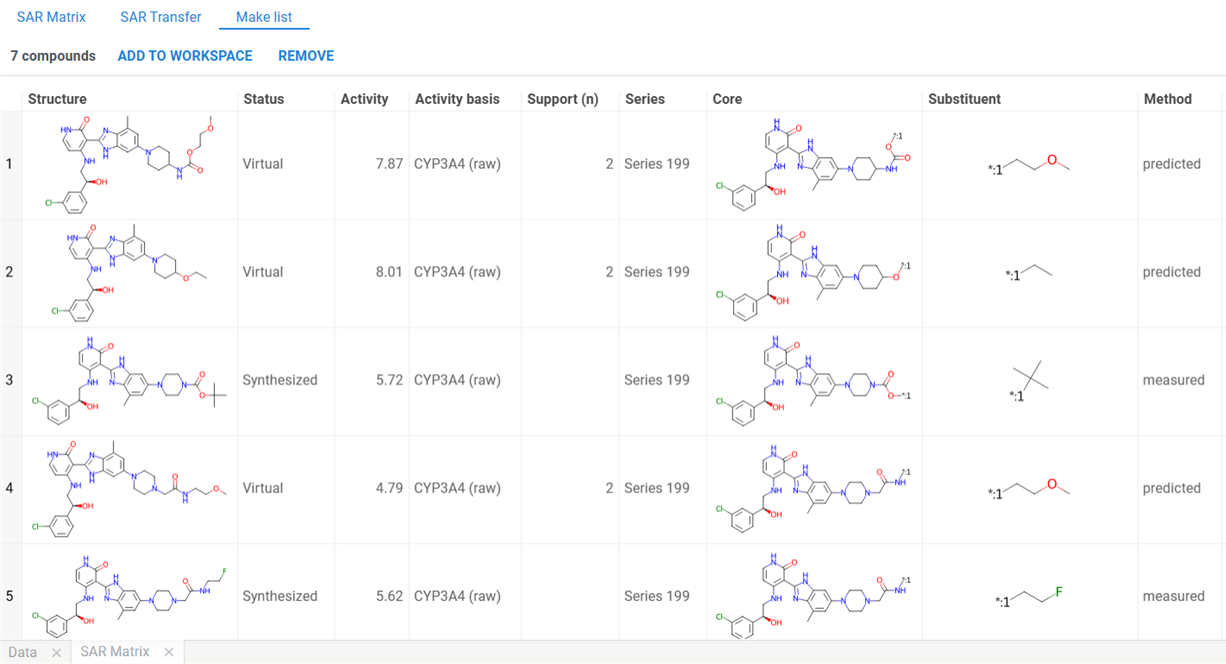
Hi everyone! We’ve been exploring a SAR Matrix analysis for the Chem package and put together an interactive prototype to gather feedback before building it. The idea is to combine two things Datagrok already has, Matched Molecular Pairs and R-Groups Analysis, into one view that organizes related compound series, colors them by potency, and proposes virtual analogs to make next.
Below is a short walkthrough of how it would work. We’d love to hear whether this would be useful in your projects and what you’d want it to do.
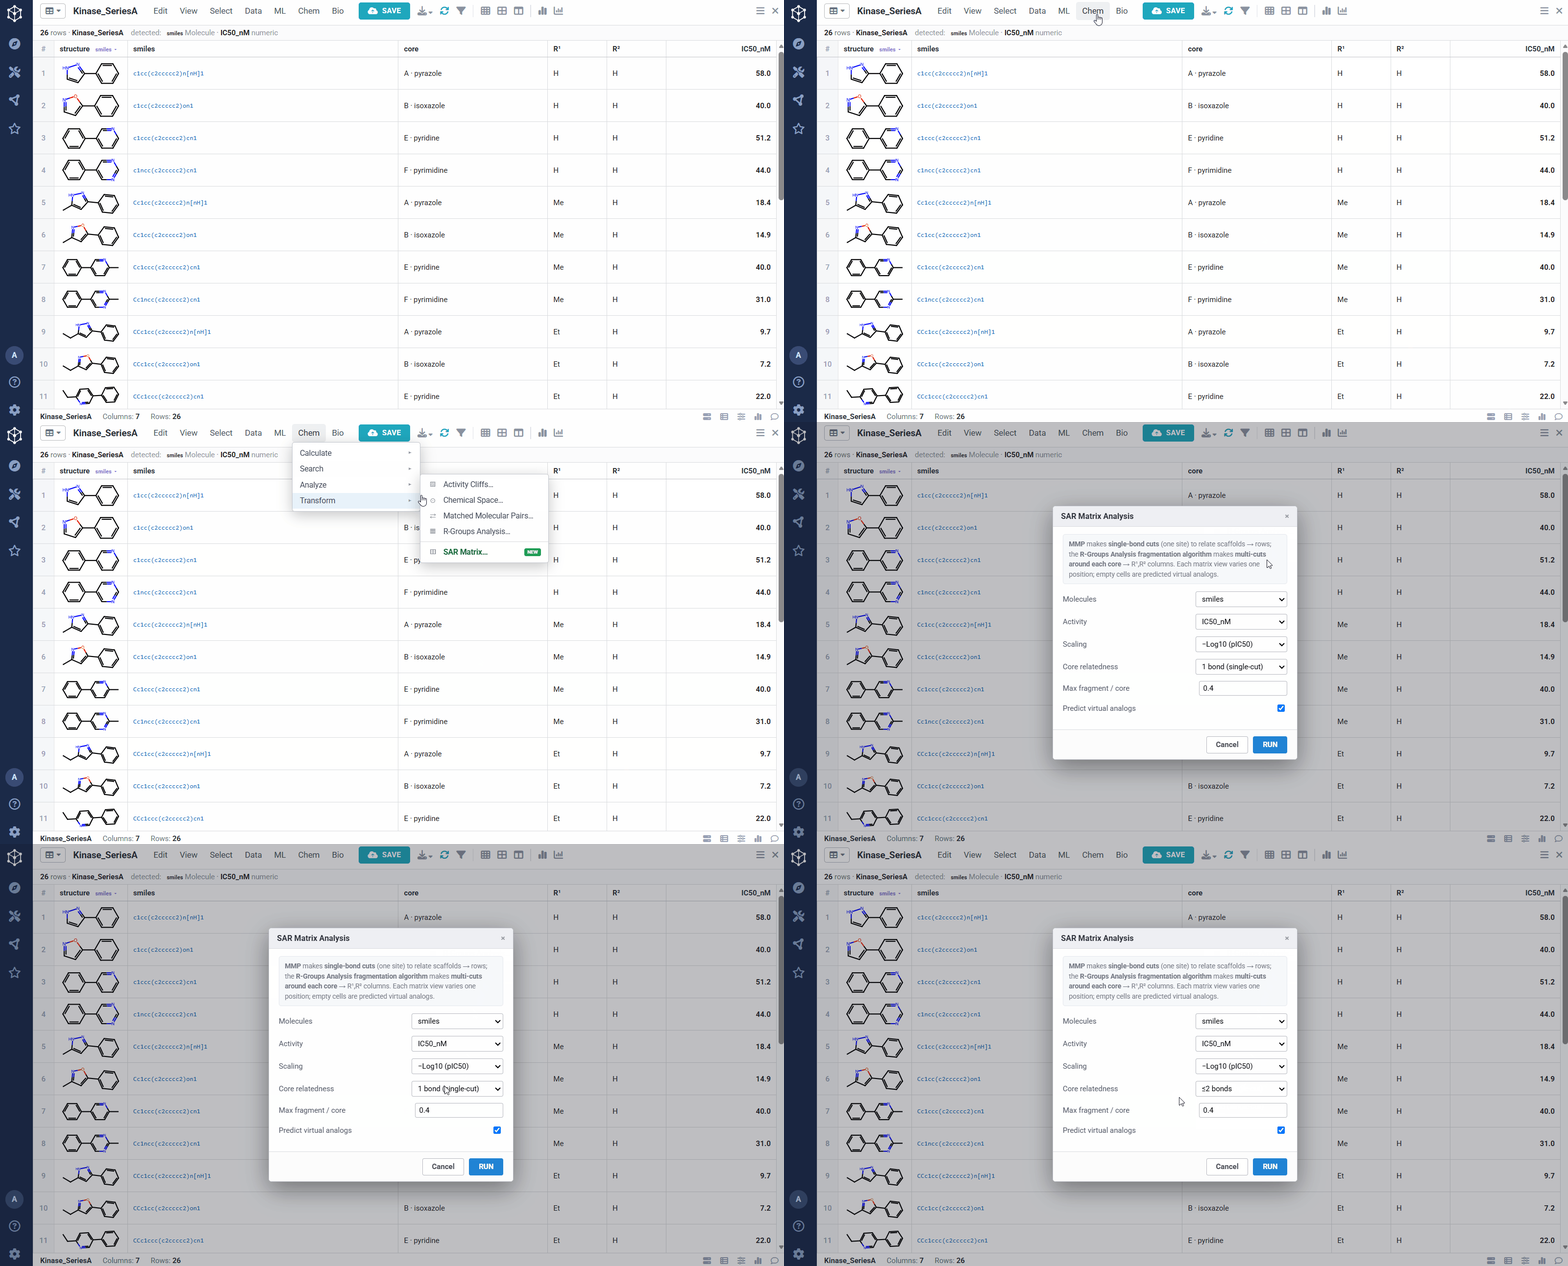
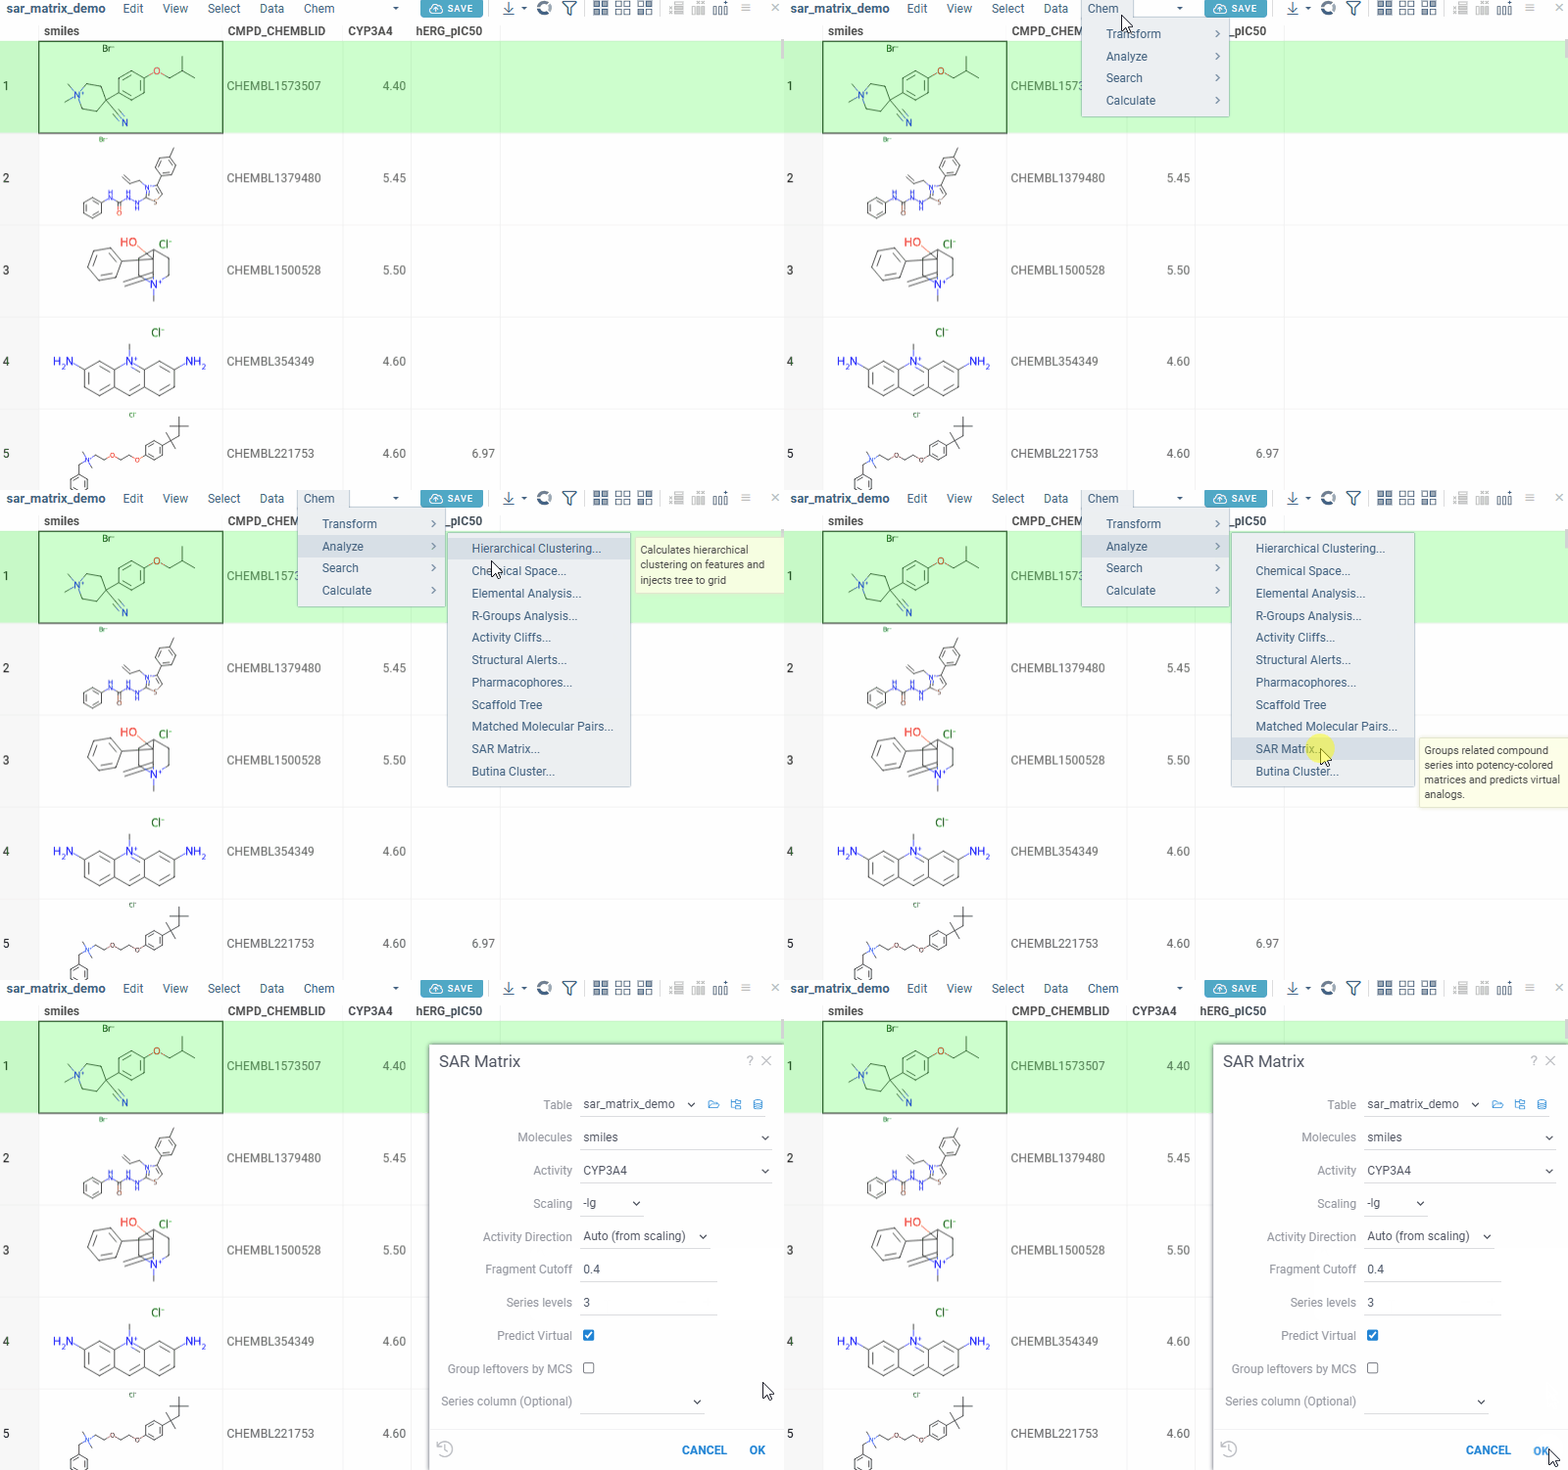
You start from any set of analogs with a measured activity, here a batch of kinase actives with structures and IC50 values, and Datagrok detects the molecule and numeric columns automatically. Running the analysis takes a few options: the molecule and activity columns, an activity scaling (pIC50, so substituent effects add up), how related two scaffolds must be to share a matrix (one bond keeps rows to closely related cores, ≤2 bonds groups more distant ones together), and whether to predict virtual analogs. From there it pulls the SAR out of the set on its own, rather than you defining a scaffold by hand.
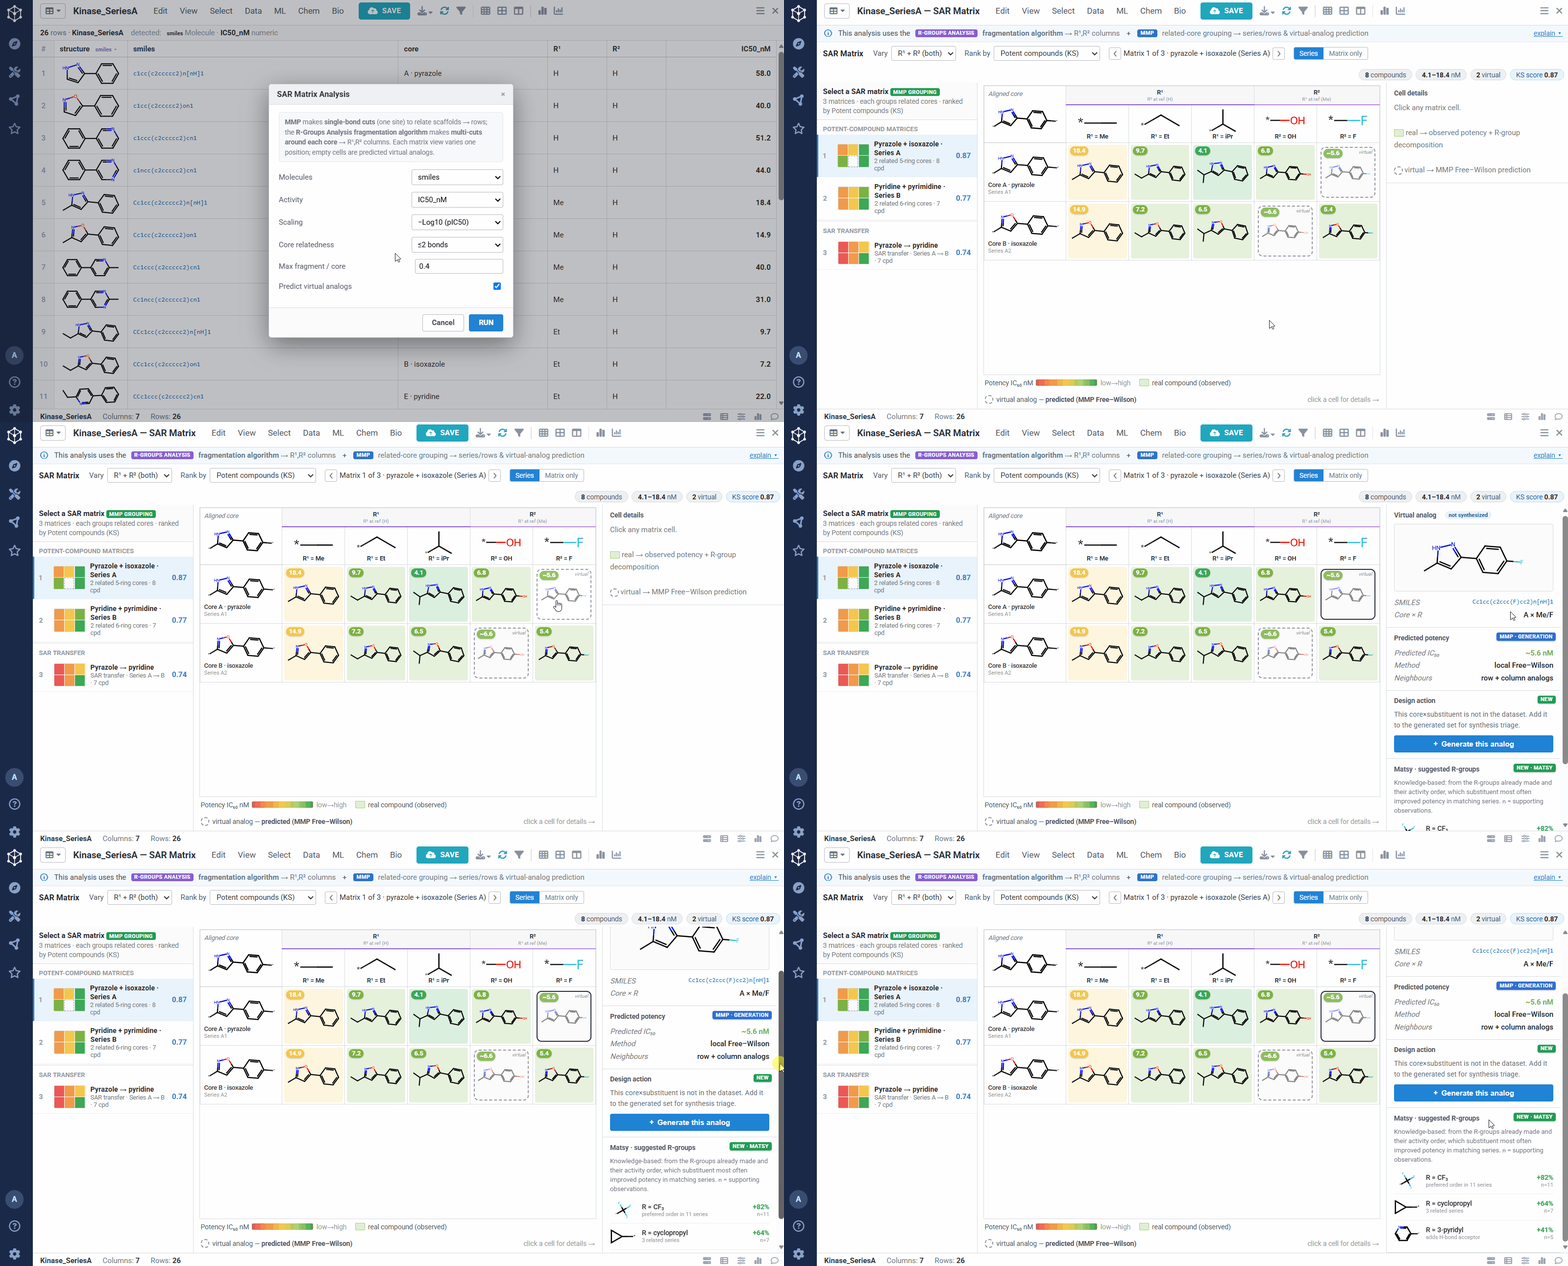
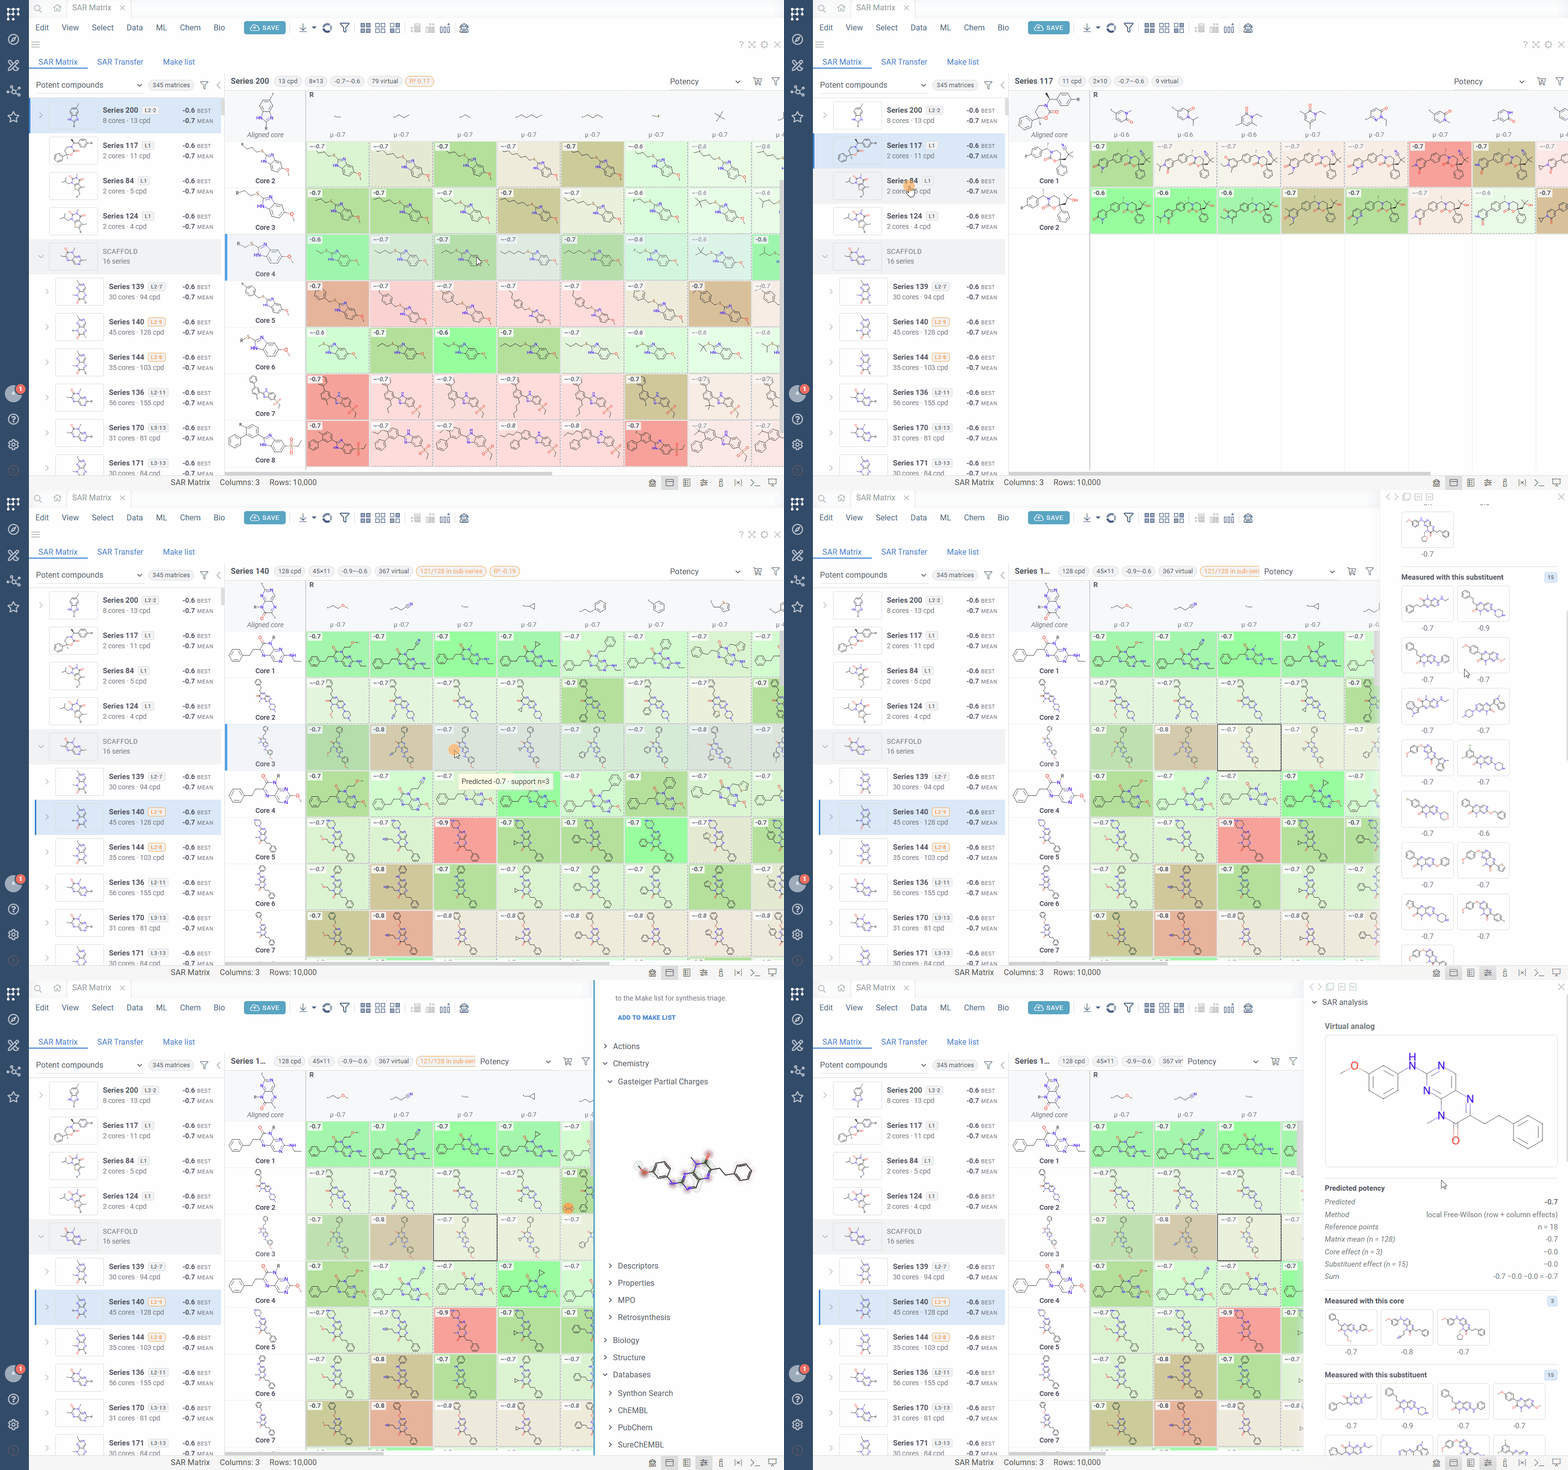
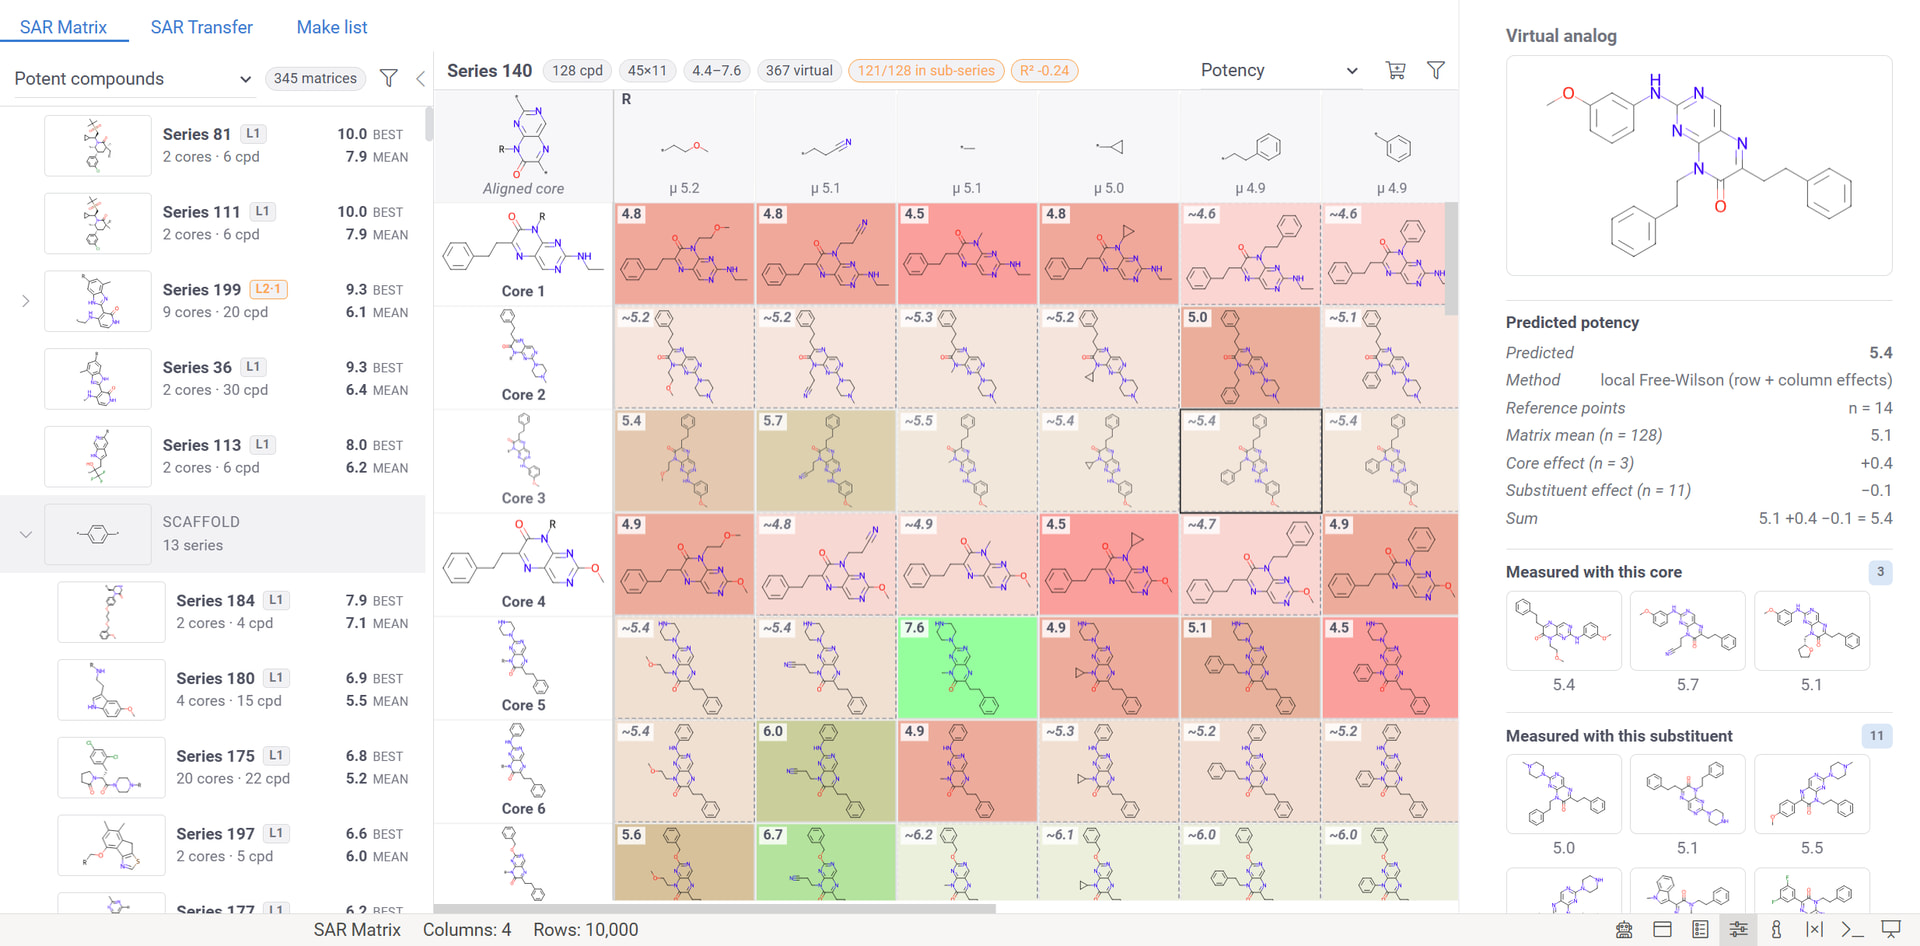
The result is one matrix per group of related cores. The rows are the related scaffolds, grouped by MMP’s single-bond fragmentation; the columns are the substituents at a position, from R-Groups Analysis fragmentation; and each filled cell is a real compound shaded red to green by potency, so a trend reads at a glance down a column or across a row. Dashed cells are virtual analogs, combinations nobody has made yet, with a potency predicted by MMP’s local Free–Wilson model. Selecting any cell opens its details, including observed versus predicted potency and the core-plus-R breakdown, along with Matsy, a knowledge-based suggestion of which substituent tends to improve potency next.
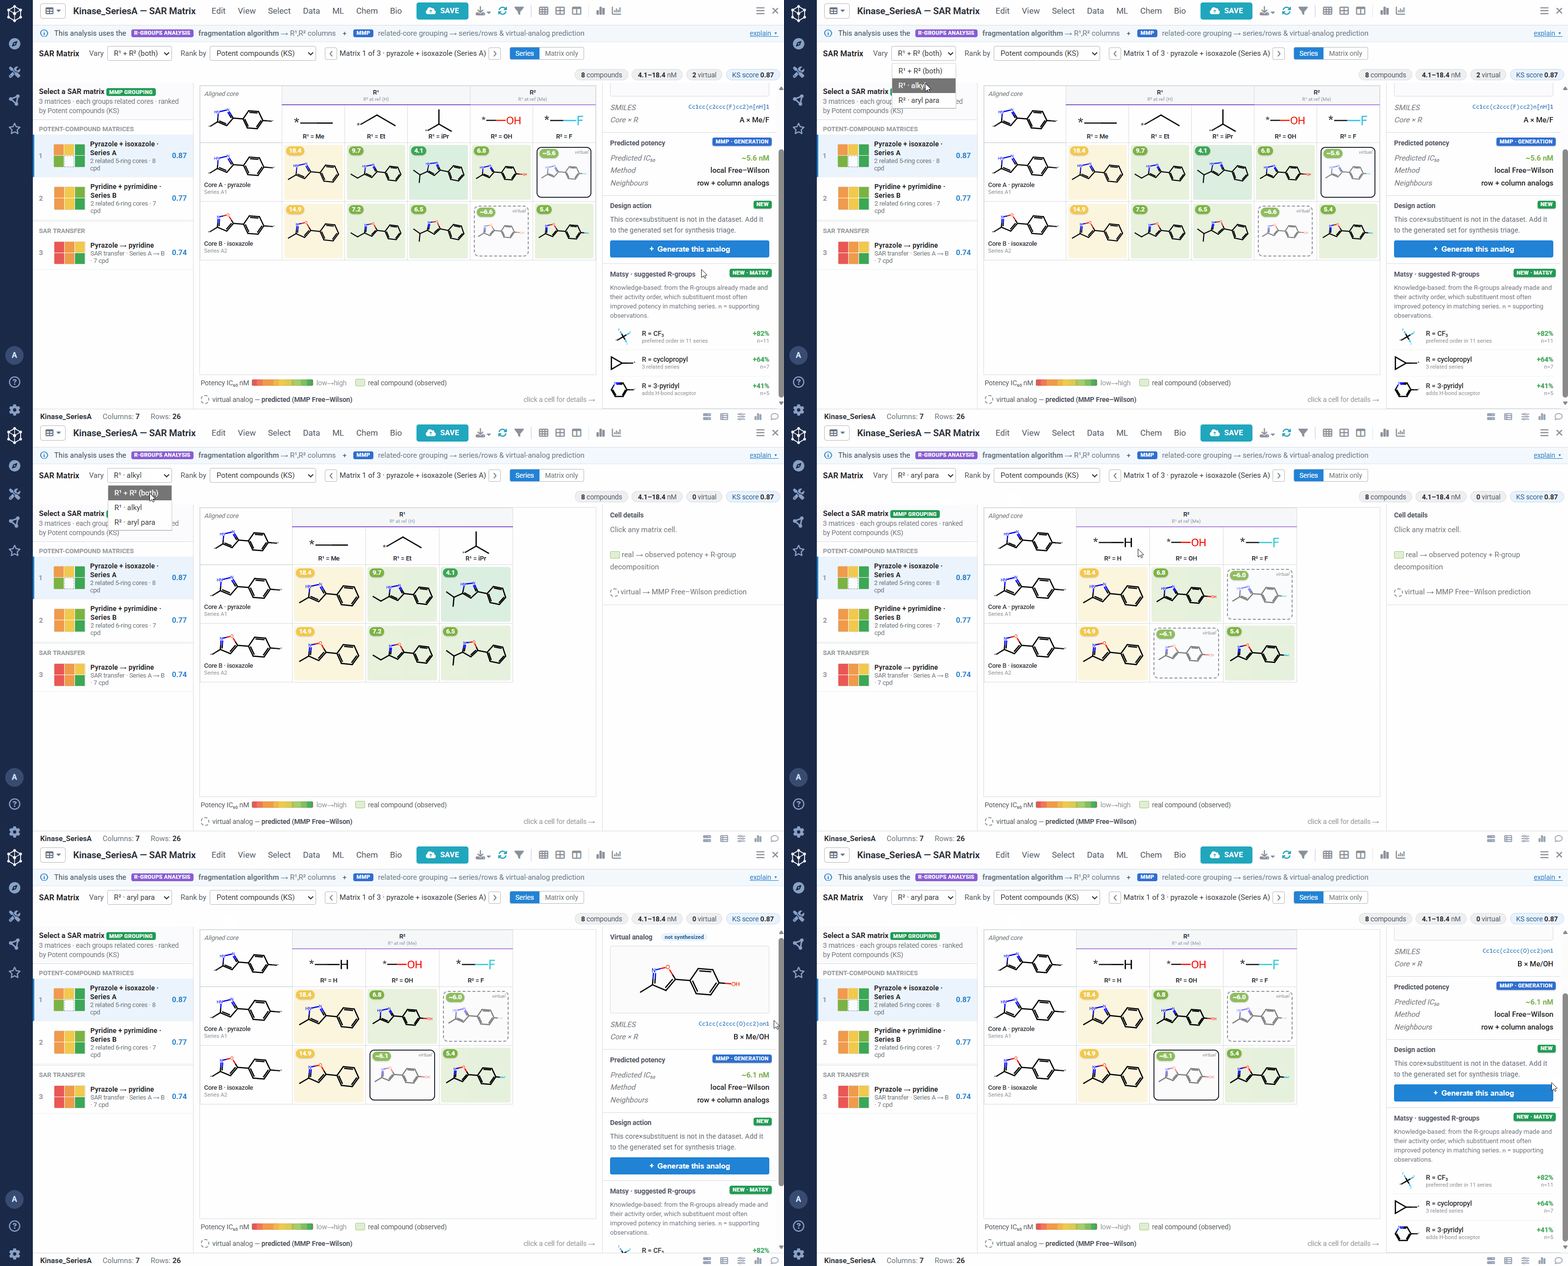
Because the R-group decomposition exposes every attachment point, you can view the SAR one position at a time, R¹, R², or both. That isolates the effect of a single vector while the others are held at a reference substituent, so it is easy to see, for example, that growing R¹ steadily improves potency.
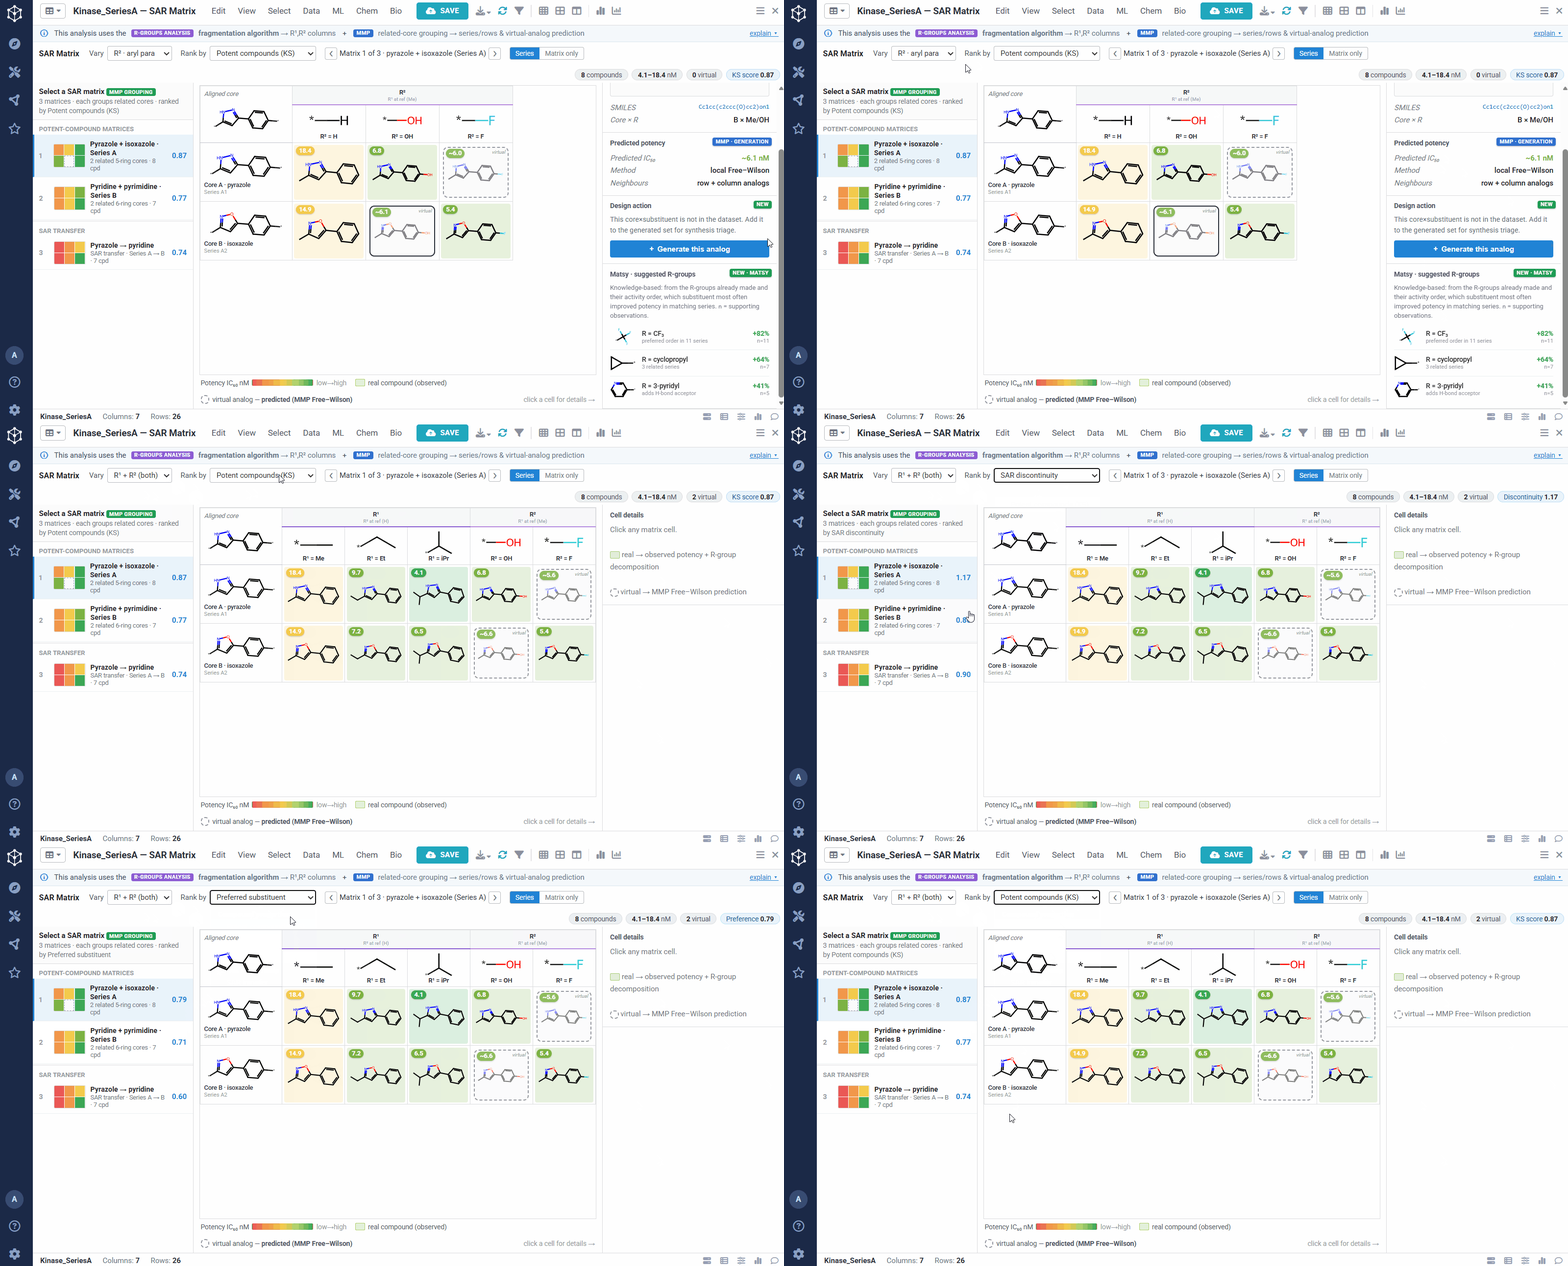
A dataset usually yields many matrices, so they are ranked to bring the most informative ones to the top. You can sort by different criteria, for example matrices rich in potent compounds, ones showing sharp activity changes, or ones with a clearly preferred substituent. The left panel lists them all, split into individual analog series and cases of SAR transfer.
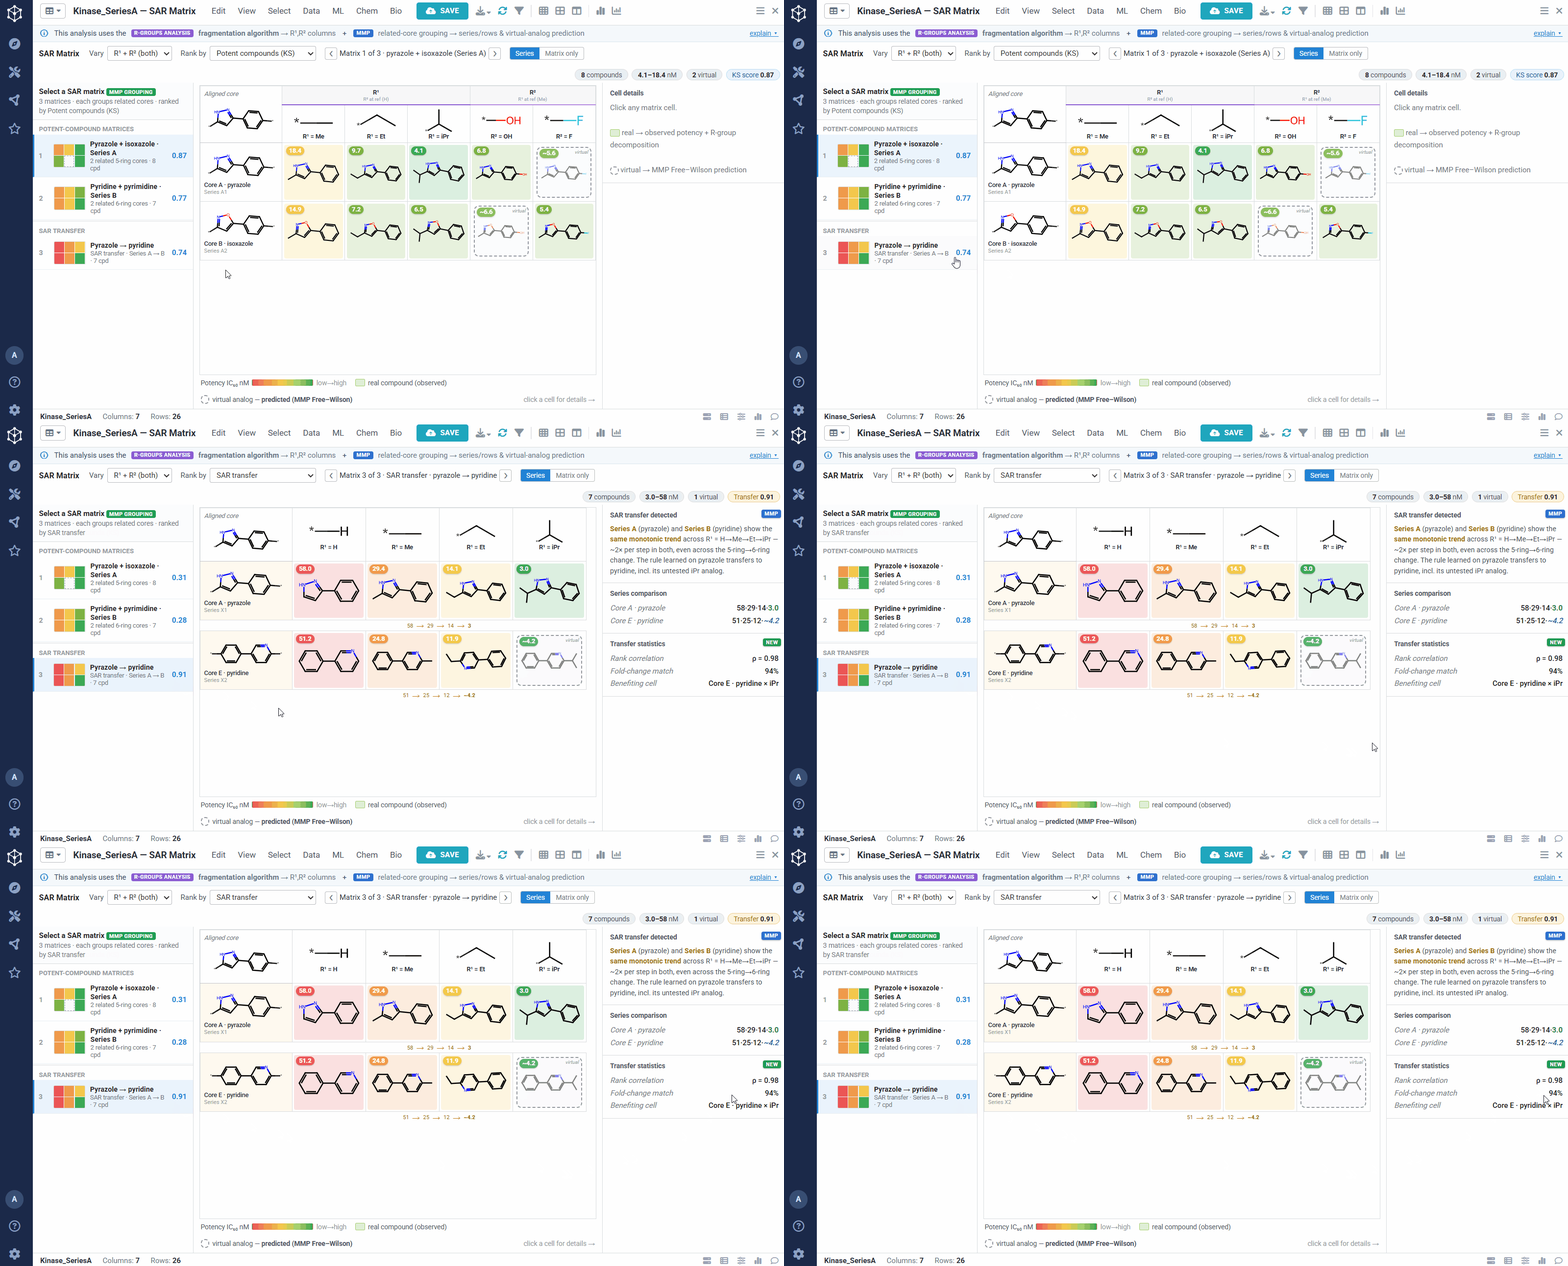
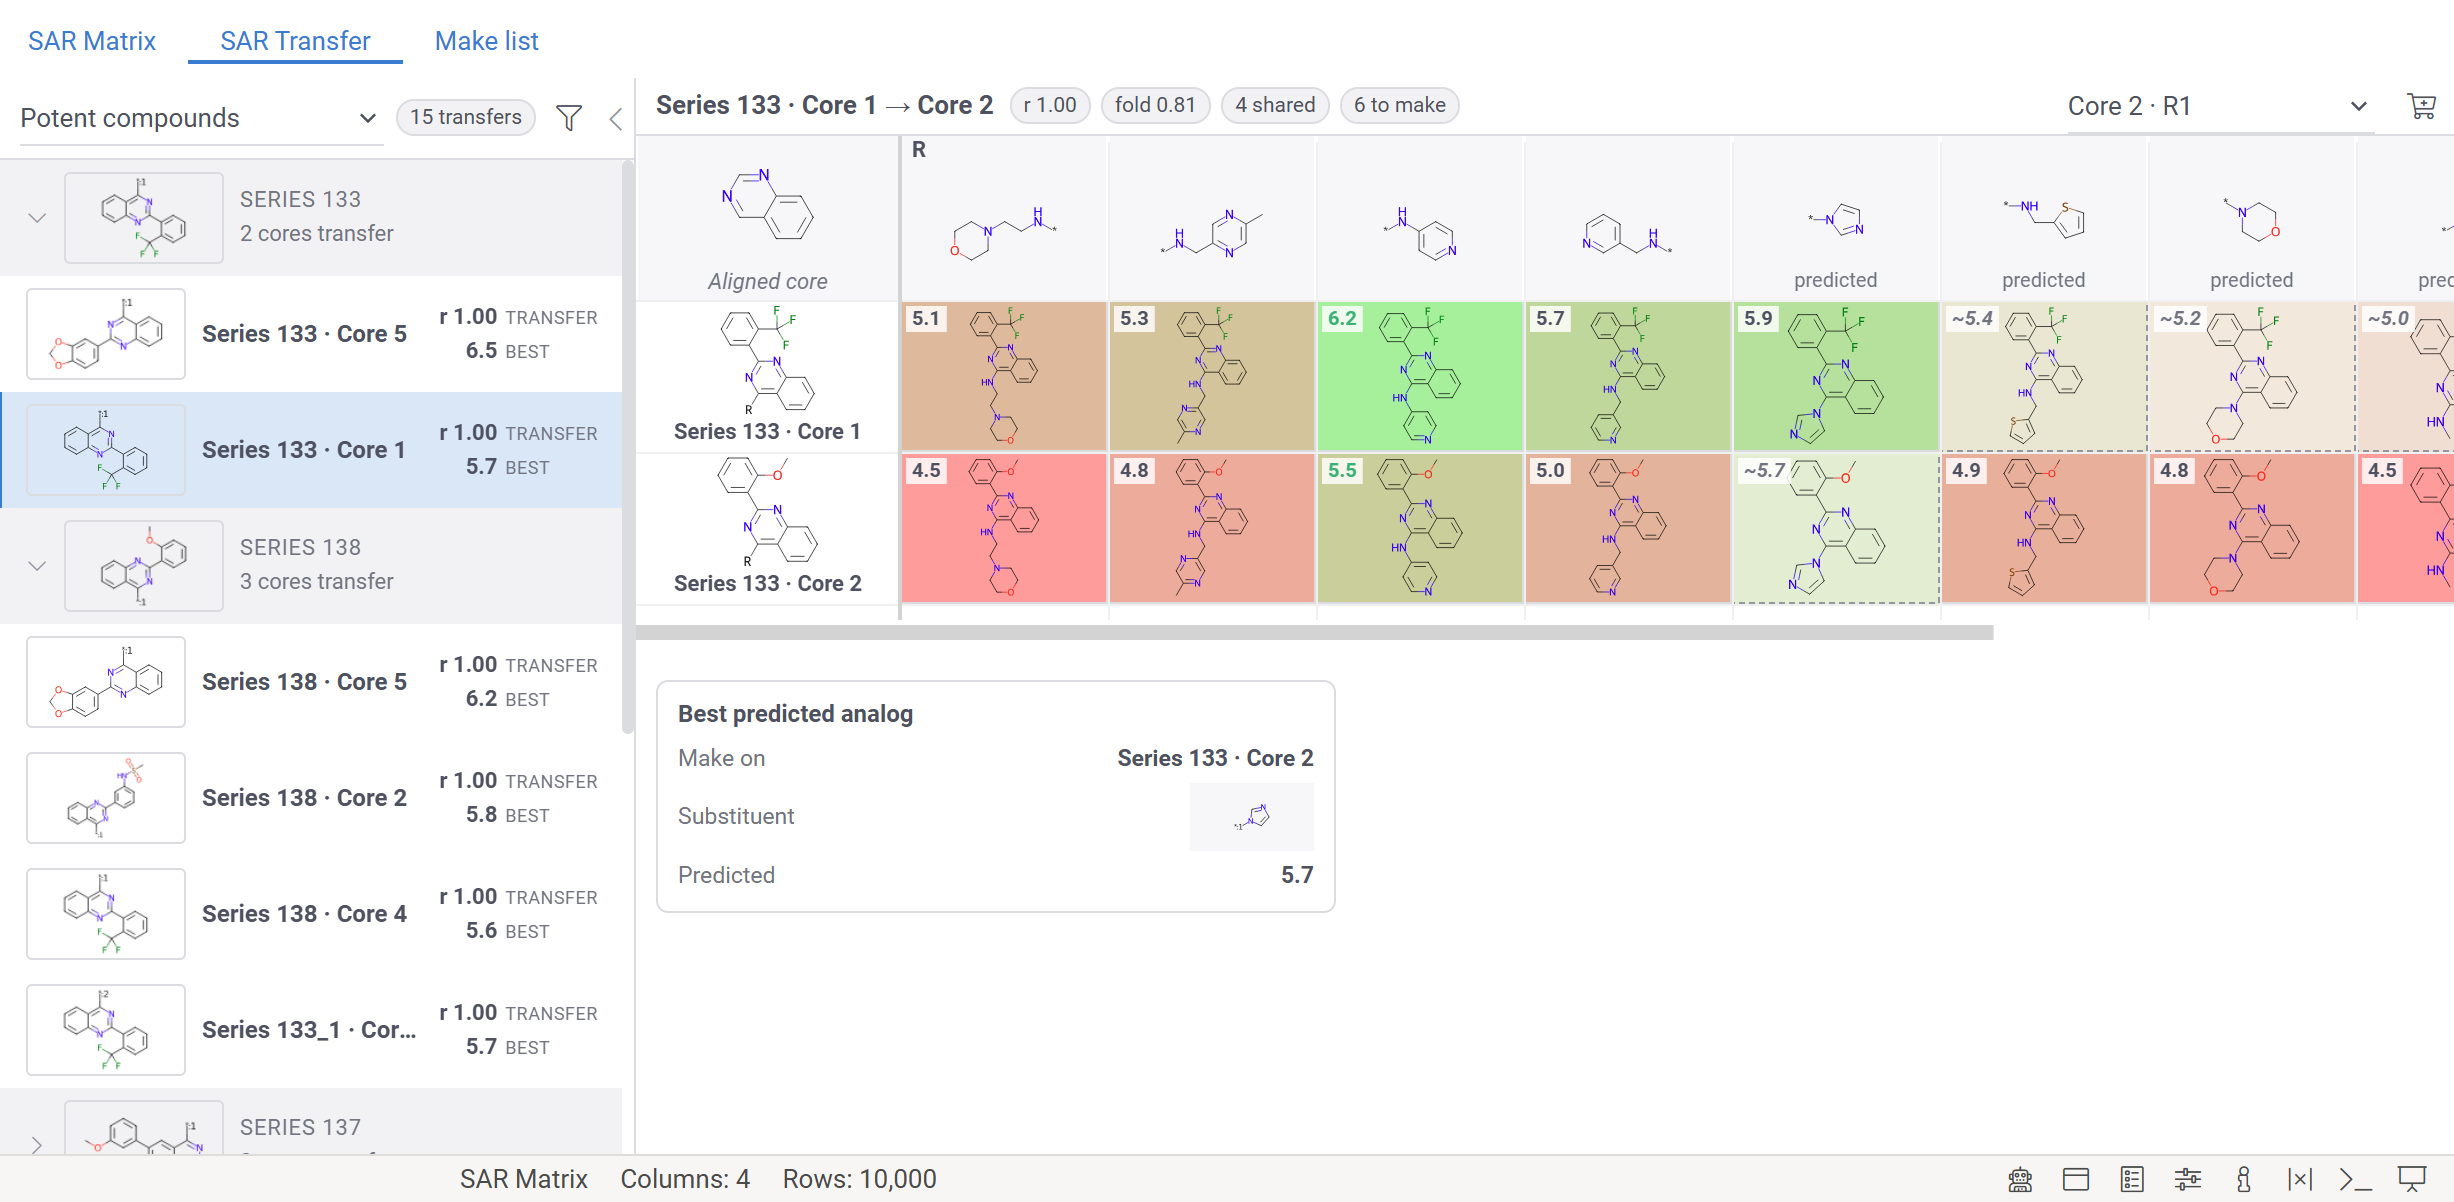
SAR transfer is the case where two related series show the same substituent changes producing parallel potency trends. When that happens, a modification proven in one series can be carried over to the other with more confidence, and the virtual analogs predicted in that matrix become safer bets. It is a quick way to borrow SAR across scaffolds instead of re-deriving it for each one.
Taken together, this makes it quick to decide what to make next by ranking the unmade virtual analogs on predicted potency, to borrow SAR across scaffolds through SAR transfer, to spot preferred substituents and activity cliffs at a glance, and to turn a hit series into a prioritized analog list without hand-building R-group tables.
This is still just a prototype, so your input genuinely shapes whether and how we build it. We’d love to know if something like this would fit into your day-to-day work, and if so, which part you’d reach for first: the matrix view itself, the virtual-analog predictions, the ranking, or SAR transfer. Is there anything you feel is missing, or that you’d want to work differently? Any and all feedback is very welcome, and we’re happy to dig into specific use cases if you have one in mind.
 I’ve spent the last couple of weeks implementing this feature in Datagrok so it can be tested out. I’ve also added an option for exporting molecules, and the input data is now linked to the matrix: you can trace a compound from the matrix back to the original dataframe and see all the information relevant to it. Here’s a GIF showing how it currently looks in Datagrok.