Scatter Plot X-axis values overlapping

Hi Team,

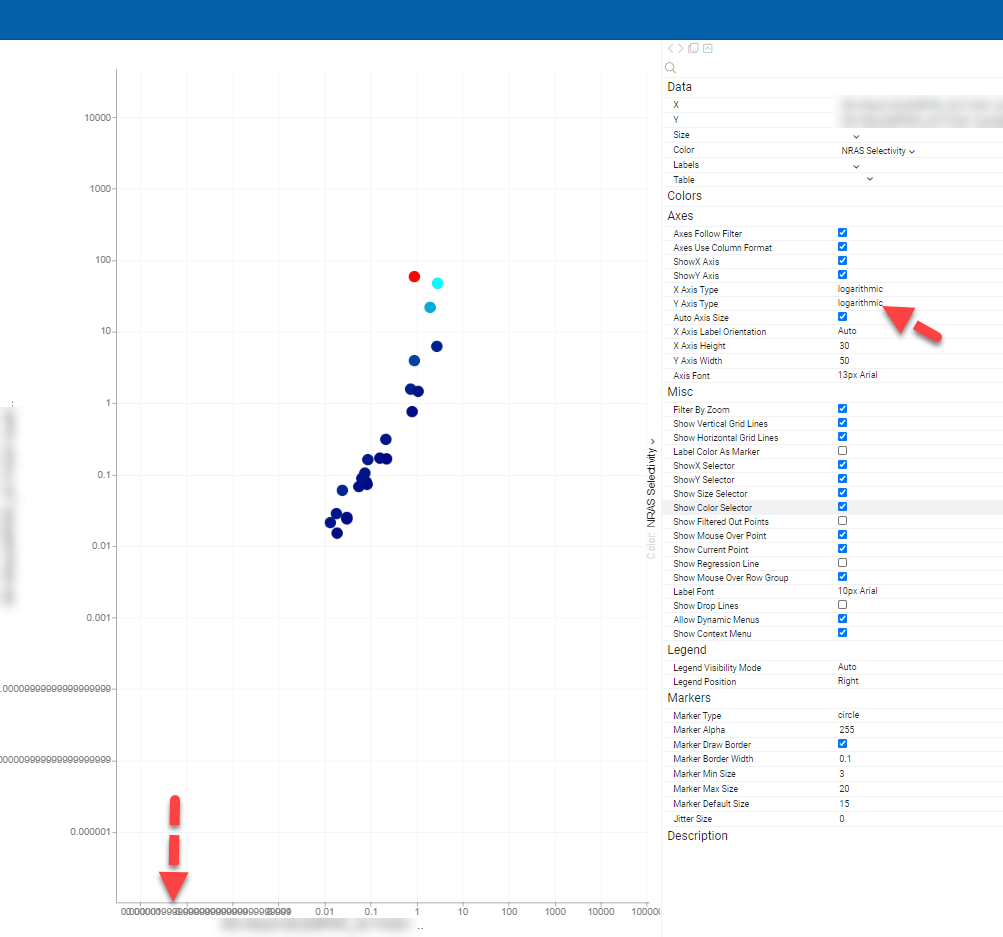
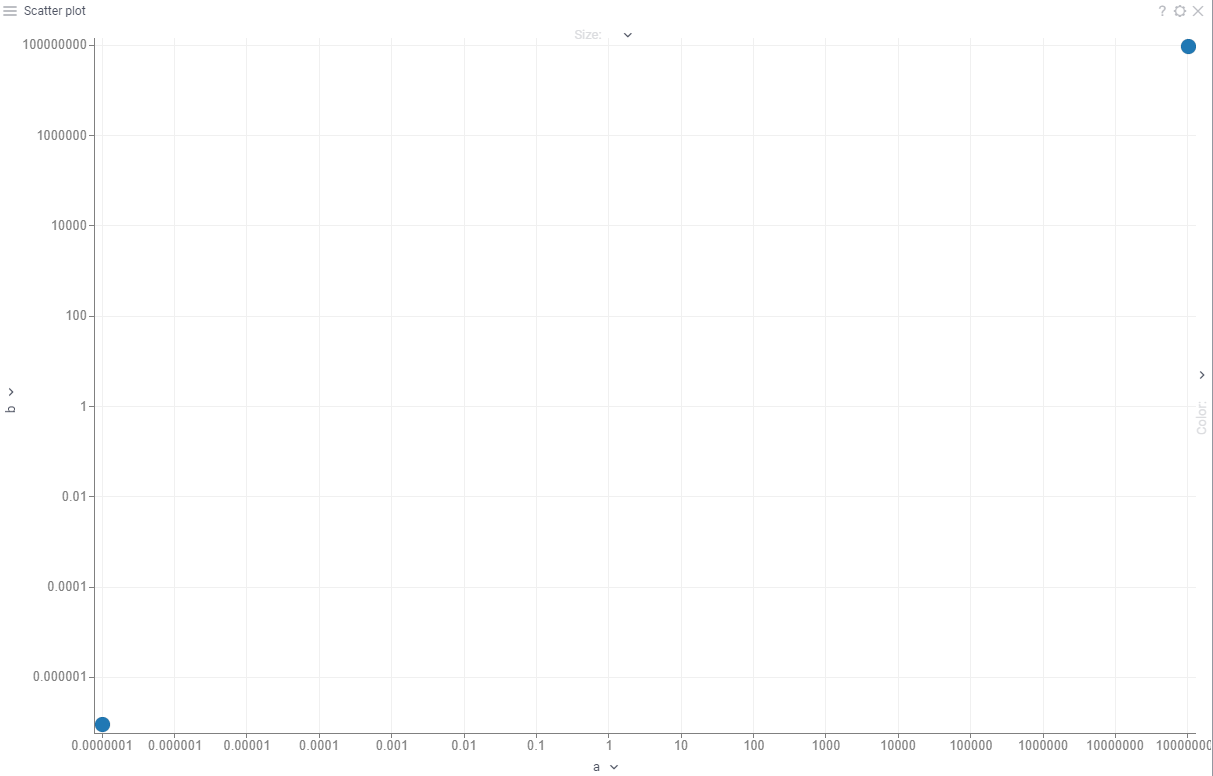
We have noticed in the Scatter Plot that if we set the Axes it plots out OK, but when we change the type as “logarithmic” the X-axis values are getting overlapped (see the example below picture). Can this be fixed to allow enough space on the axes scaling values to fully fit in?

Thanks

Thanks for reporting it! We have made the following improvements to address the issue, so everything should work properly now:

  • proper rounding (0.00009999999 becomes 0.0001)
  • skipping every N-th “power of 10” tickmark when it becomes too dense.

1 Like