Hi team,
I have a couple of points on the scatterplot:
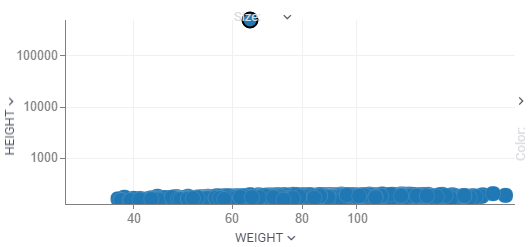
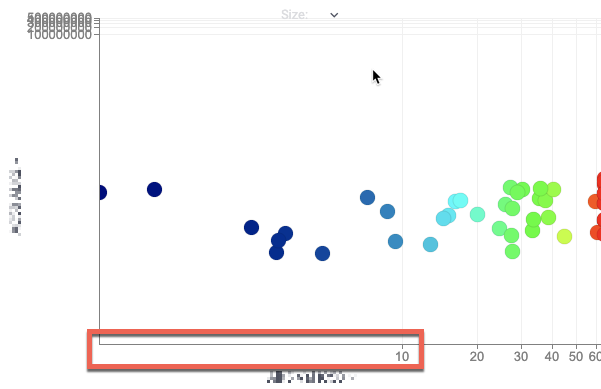
- It seems like when I switch the axis from linear to log in the scatterplot, the entire configuration menu suddenly disappears
- The log scale is sometimes behaving weird
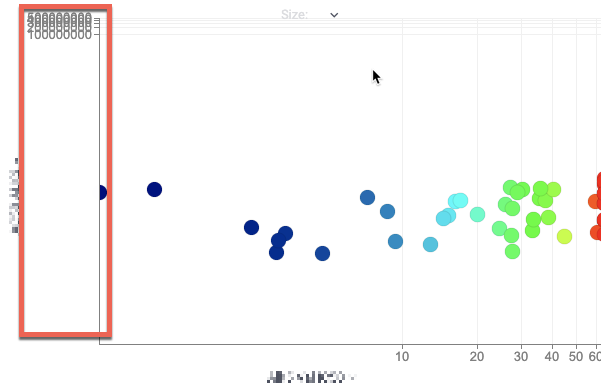
- Would it be possible to see the ticks on the axis for the smaller log value, e.g. between 1 and 10:
- Could we also change the color scheme for the scatterplot to a freely-defined one, like it seems to be possible with the table visualization?
Thanks
Nico