Hi,
I would like to know how to show error bar in LineChart.
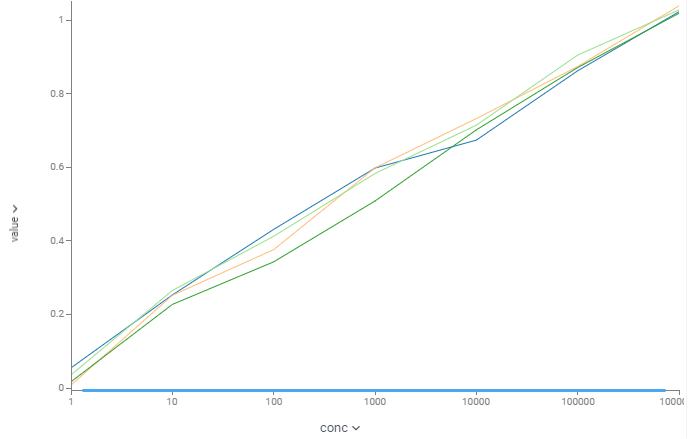
As you can see an attached image, multiple line graphs are stacked. Each line shows mock dose response curve data, so x axis is concentration and y axis is value for assay activity.
If standard deviation can be drawn as whisker, it would be more favorable to my situation. If there is already an option please let me know. Or, if there isn’t I, wonder if you could deal with it.
Of course, curve module already exists in datagrok but merging each curve into one figure has not been equippd yet, as far as I remember.
If my question is not clear please let me know. I would appreciate your help in advance.
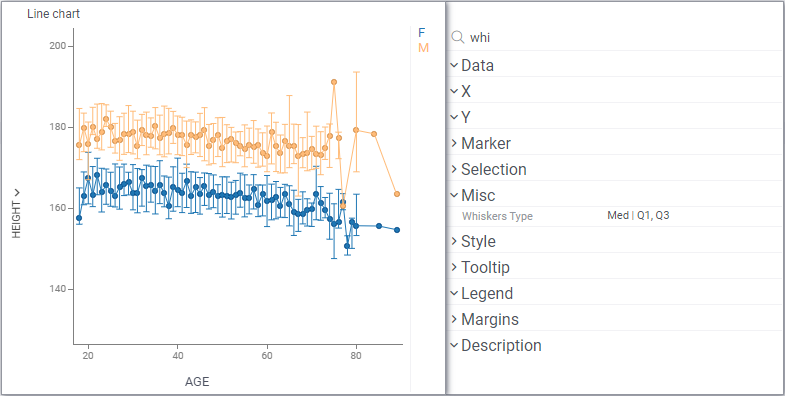
Hi Kosuke, yes this is supported in line chart, check out the Whiskers Type option under the Misc panel (sorry, it’s hard to find, we’ll move it under Data):
Hi, Andrew,
Thank you for your quick note. It’s exactly what I looked for. Both whisker type setting in line chart and multi-curve-viewer would work for me. I will check multi-curve-viewer at first.
On the other hand, whisker type setting seems that whisker width is calculated after aggregation of multiple data to form each line graph. Is it possible to assign whisker width by designating a specific value? I am thinking I would like to connect representative points and each point has data for x-axis, y-axis and whisker width. For example in dose response curve, x-axis is concentration, y-axis is mean activity value, and whisker width is standard deviation.