Hi Team,
It seems like in some cases the scatterplot is rendering the dots in a very small scale:
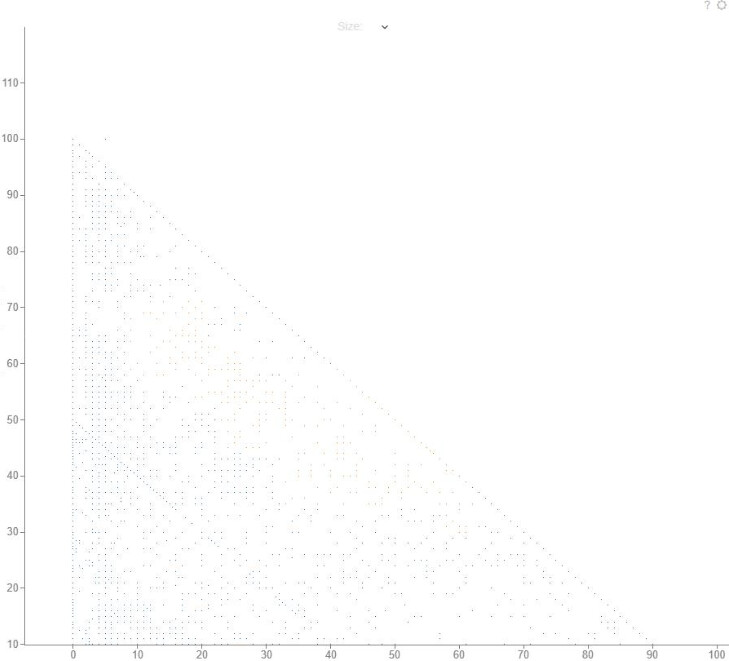
It’s not only hard to actually see the data pattern, but also which elements are selected (orange) and which not.
Hi Team,
It seems like in some cases the scatterplot is rendering the dots in a very small scale:
It’s not only hard to actually see the data pattern, but also which elements are selected (orange) and which not.
Scatter Plot attempts to render the scene in the best way possible, and the size of the marker is actually determined by the number of markers. The current (recently adjusted) settings are the following:
There are many markers in your example, you have many markers, so the scatter plot made a decision to render it as dots. Apparently this wasn’t the best decision, since many markers overlap anyway the resulting scene did not get much better. We should probably take such situations into account.
Anyway, in order to go back to the default markers, set it either via the “Markers” section on the property panel, or by right-clicking on the scatter plot and choosing Markers | circle.