I would like to suggest the additional functionality to the “Chem | Analyze | Hierarchical Clustering” feature.
One of the advantages of this tool is that it supports the Ward method clustering. Since it allows users to view dendrograms, it offers a visually intuitive way to understand clustering results.
Besides, the Ward method is a reproducible method, so it would be very useful if we could set a threshold to divide the data into an arbitrary number of clusters.
Currently, the Ward method appears to be limited to visualization only. I would like to kindly suggest considering the addition of new functionalities.
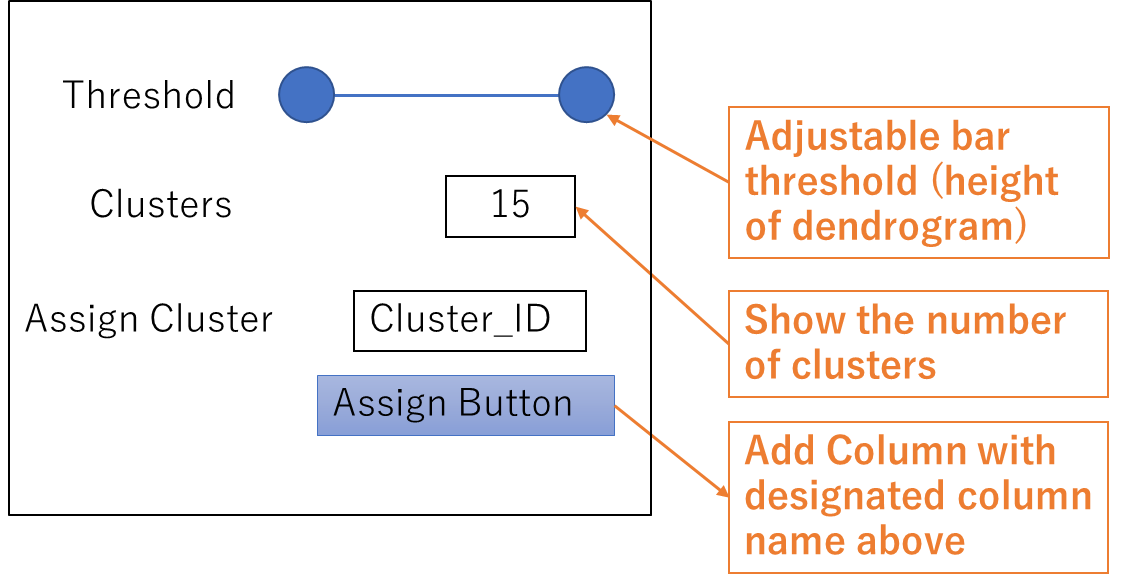
For example, it would be helpful if users could specify a threshold to determine how many clusters the data is divided into, and be able to add a column with cluster numbers assigned to each data point.
For your reference, I attached an image that illustrates this idea. I hope this can be helpful in considering future improvements.
We always greatly appreciate your feedback and ideas! Here’s a ticket to track progress on this feature: #3641 Chem: Add ability to determine the number of clusters in Ward hierarchical clustering
I appreciate your prompt action to issue an ticket.
I consider my suggestion again and found that setting threshold needs single value, so double sided slide bar is not necessary as shown in image above. Anyway, if you have any questions or comments please let me know.
Thank you for the great suggestion. Indeed, what you mention is very useful, especially considering that all the information is already there and its easy to compute.
We have released the Dendrogram plugin version 1.4.6, which includes this update.
Also with the new version (along with some bug fixes), the generated dendrogram panel is now resizable. you can grab it at the edge and resize to desired width.
To cluster your data and generate a column, you can right click on the tree panel and choose assign clusters, or click on the button on the top left corner. In the dialog that opens, you can specify the Tree height threshold (height is counted from the root), or the number of clusters you want to get. in both cases, second input will be recalculated automatically. The threshold is in units of tree absolute height, so it is quite arbitrary. Let me know if it would make more sense to have threshold between 0 and 1 and then map it to tree units. The cluster column generated will be named `Cluster(thresholdValue)`, so that information is also preserved.
Thank you for prompt deployment of highly improved feature for Ward hierarchical clustering.
I think what I suggested has been fully covered with the new function. Let me and my team try it and give some feedback if there are any additional suggestions or questions.
I realized that for crammed dendrograms (especially using ward clustering), heights of the nodes can be very close together, even so that with resized panel, it is hard to distinguish.
The latest version of the plugin (1.4.9) now includes ability to zoom in the dendrogram leaves, to better see connections (video bellow). Zooming can be achieved via ctrl+mousewheel. double click on the empty space in the panel to reset zoom.
Also, when you open the cluster assignment dialog and move the cutoff slider, there is going to be a red vertical line indicating the position of the cut.
Thank you for the further update. It is definitely useful for users to visually check the dendrogram and set the threshold precisely. Also, the attached video is easy to understand. By improving the dendrogram feature, it will be possible to more quickly visualize and check a large number of structures through clustering and dividing them into a designated number of chunks containing similar structures, allowing me to focus on a smaller number of structures within each cluster.
Thank you for the continuous improvements to the Dendrogram plugin.
I would like to request one additional feature, if possible. Could you add a centroid column to the data table output after clustering is applied?
Specifically, my idea is as follows:
After the user sets the number of clusters (or a threshold), a new binary column (0/1) would be added to the table.
For each cluster, the row that is closest to the centroid of that cluster would be marked as 1, and all other rows in the same cluster would be marked as 0.
This would allow users to quickly identify the most representative structure within each cluster.
This feature would be particularly useful in our use case, where we deal with a large number of structures. By selecting only the centroid rows (i.e., rows marked as 1), we can efficiently extract one representative structure per cluster for further analysis, without having to manually inspect all members.
I understand this may require additional implementation effort, so please let me know if any clarification is needed.
Thanks for the great suggestion. indeed, this is a very useful feature, and could be further useful in other clustering methods, like UMAP.
Just to confirm one thing, ‘closest to centroid‘ - I interpret as the ‘midoid‘, as in the structure that has lowest sum of distances to other compounds within a cluster. basically, if we have a distance matrix of the cluster, we sum the columns and pick index with lowest sum. in terms of non-additive distance functions like Tanimoto, centroid is more abstract and we can use what I described above.
If this is the case, I already added the feature to dendrogram and will release once you confirm.
Thank you for the clarification. Yes, your interpretation of the medoid concept sounds correct to me — selecting the structure with the lowest sum of distances to other compounds within a cluster makes perfect sense.
Additionally, I have one more suggestion to discuss: instead of returning binary (1/0) values, would it be possible to return incremental rank values? This would allow us to extract the Top N medoids from each cluster, which could be quite useful in practice.
I completely understand this may add implementation complexity, and I leave that entirely to your judgment. Please let me know your thoughts when you have a chance.
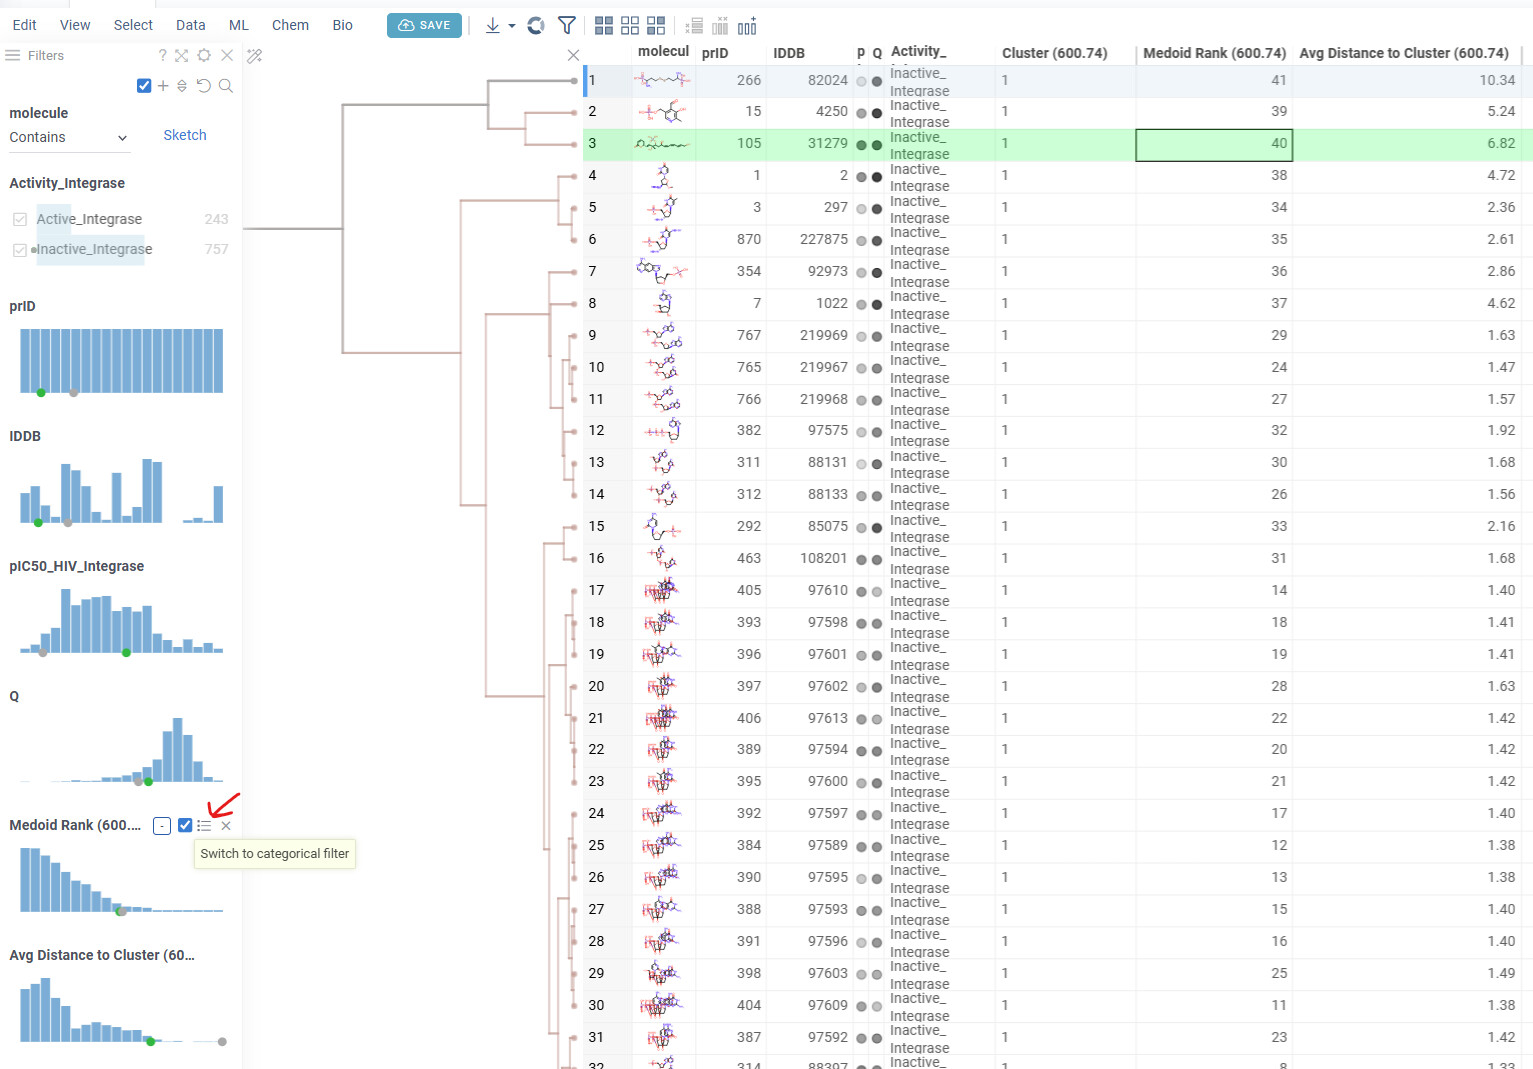
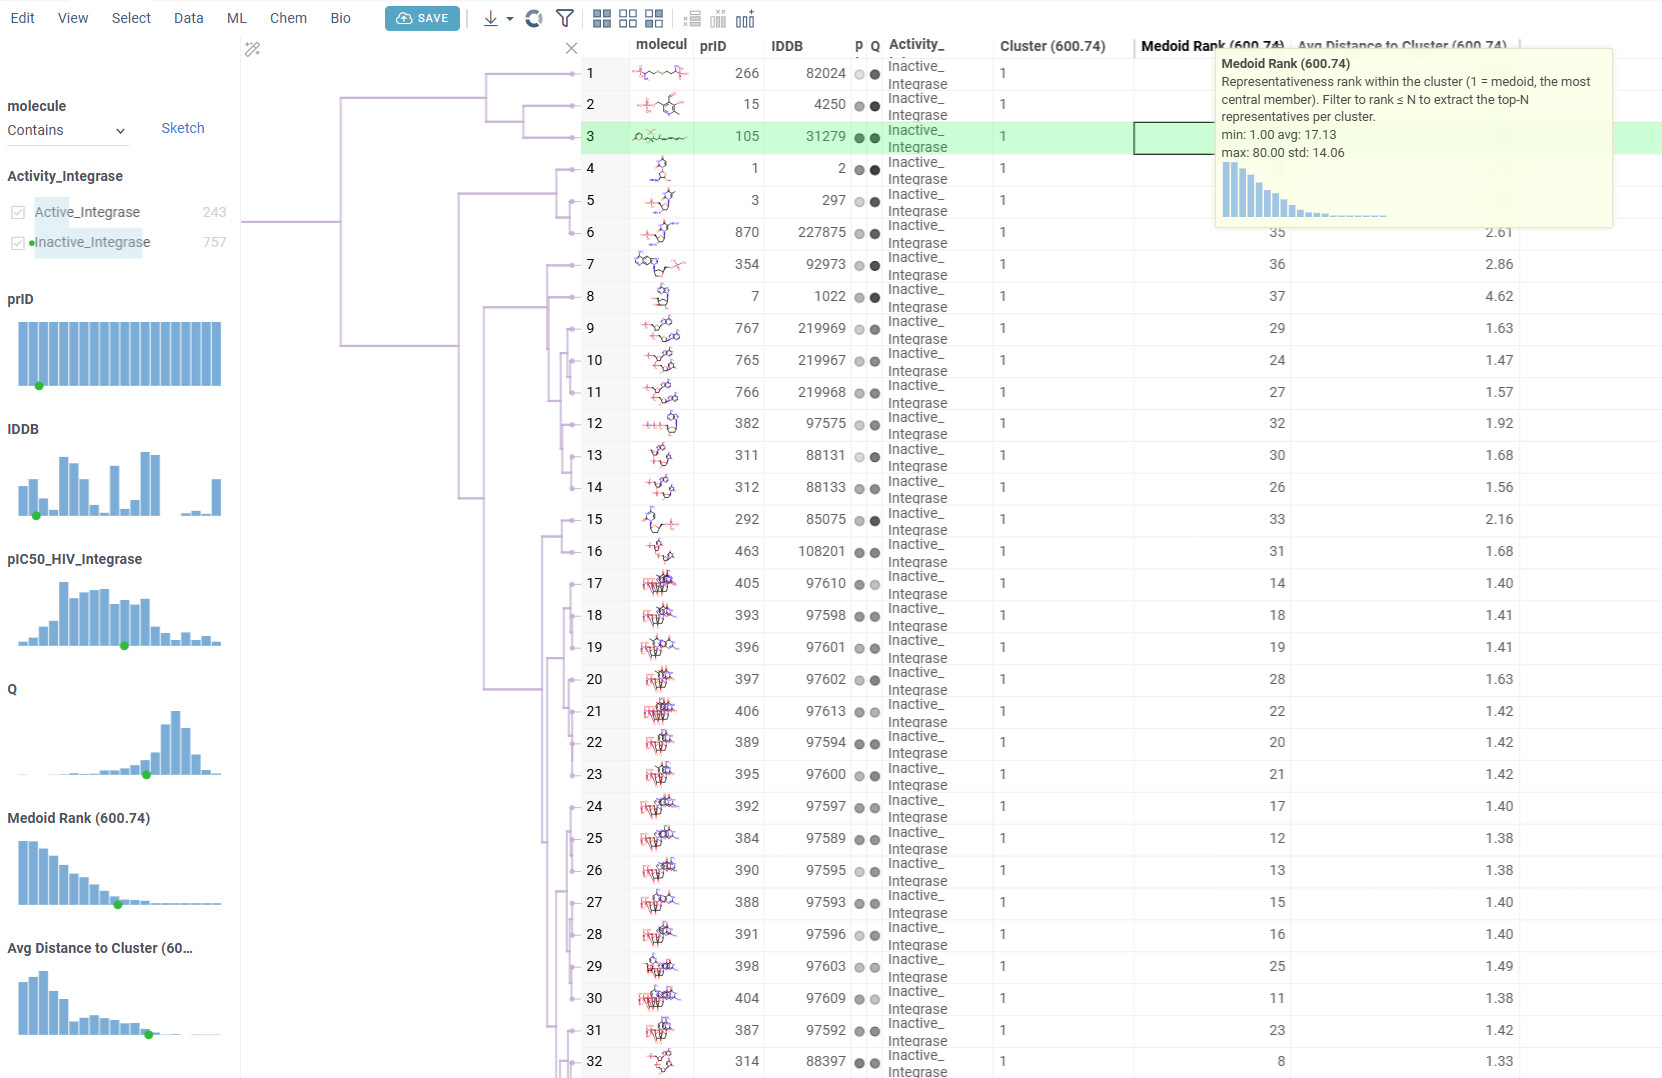
Dendrogram 1.4.15 has been released with said update. clustering on dendrogram now produces 3 columns - cluster, medoid rank and avg distance to cluster. these columns will have description on them and hovering over the header will show it. the rank column is numerical, but in filter panel you can switch the filter to categorical mode (image 1) to filter it easier.