I played with the sunburst plot on the public DG instance and like it very much
Some feedback:
It seems I cannot define the order of the hierarchy when selecting columns in the property menu (i.e. the first column in the order of the table is always the first in the hierarchy).
I could not figure out how to “select” the rows from the sunburst plot. Is there a way doing this?
How difficult would it be to render structures on this plot?
Hello, Nico!
Glad to hear you liked our Sunburst plot!
As we talked, you can re-order columns by drag-and-dropping them in the column selection dialog, but we’ll fix the order after reopening the “hierarchy dialog”
Regarding selection - there is no such functionality as selecting the rows from the sunburst plot, you can only select them in the grid and see the selection on the viewer
Also, what did you mean by “rendering the structures”? Do you want to render molecules on it, what it should look like? @skalkin, maybe you can explain?
Is the selection from the Sunburst plot something which would be possible in theory? I can see some use-cases where people want to dig into the data and then select a specific segment for further processing outside of the Sunburst plot.
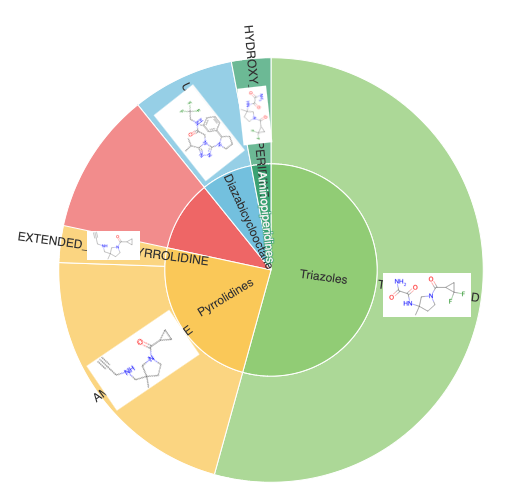
With the structures, I was thinking something like this (just a quick & dirty mock):
Regarding selection - yes, it’s pretty possible. Even more, I have just tried implementing it, and I succeeded in it. So, I guess, we’ll test this functionality and add it in newer versions of the Charts package.
Regarding structures - if I understand you correctly, you want to add, for instance, a molecule as a hierarchy column, and render it on sunburst instead of the name, right? We’ll research the possibility of implementing it, but I guess it will be much harder as we’re using the ECharts library to render this plot, and it doesn’t provide this functionality.
@dkovalyov, I’ve investigated an opportunity on adding structures as labels instead of names and it is not really hard Apache ECharts allows adding images to the plot, we can do the same for canvas.
@oserhiienko, glad to hear it! @nico.pulver.novartis.com, these updates are coming in the new version of the Charts package, I will notify you in this thread when the functionality appears.
I was just playing with the latest version of the Sunburst plot, but I could not figure how you can select rows from it.
Could you please quickly tell me?
Thanks
Please, try the new one Charts version (1.2.2). In the updated version, we have resolved the issue with Mac keyboard shortcuts. Additionally, I have included a GIF that demonstrates how the functionality should operate.