Treemap clarification

A couple of questions regarding the treemap:

  1. Split by number is not consistent with hierarchy indication on the tree map. It seems Split by number in the treemap’s properties is always one extra? Diana reported this in your tracking system.
  2. When I select columns in the properties Split by, how the left menu on top of treemap supposed to show? What’s the order based on? I tried to select/unselect few times, then left menu is kind of messy.
    image
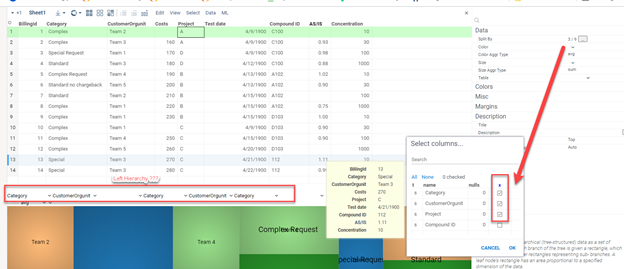
  3. Split by can only be string? Is there any plan to add other data type?
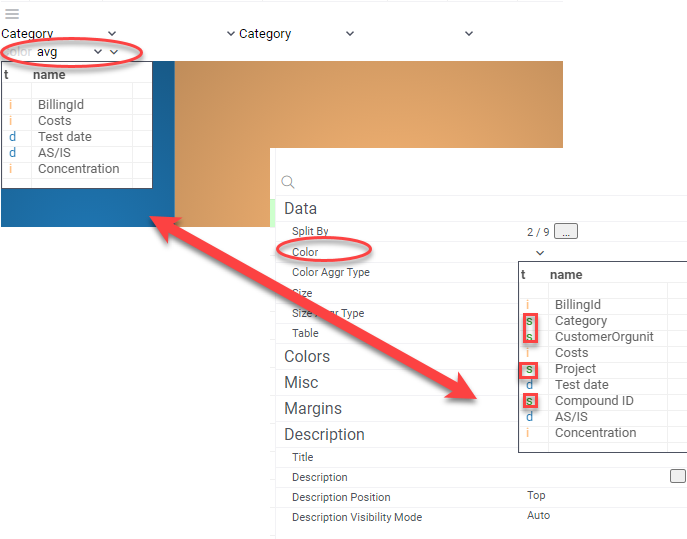
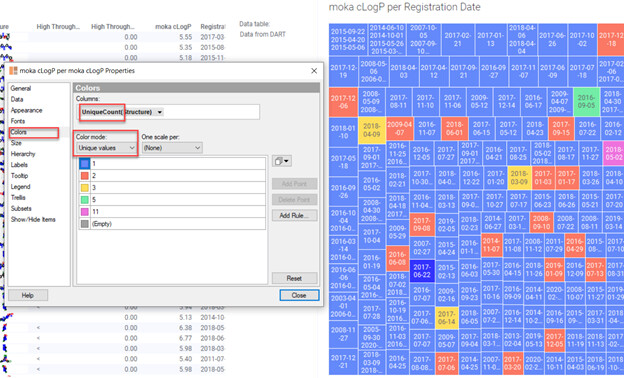
  4. Can we customize the color? For example in spotfire we can customize the color and choose different type of aggregation and color mode. In datagrok, it seems that we can only customize color on column value but not on column aggregation value?
    image
  5. Color by menu doesn’t consistent with properties data color.
    In the color by menu on top of treemap, there is no string value I can choose. But properties window color has all types.

    Thank you!

Hi Jianmei,

Thanks for the feedback!

  1. Agree - this inconsistency will be fixed.
  2. At the moment, it’s best to select the columns using the selectors on top of the tree map, as the column editor does not support reordering columns. We are planning to address that in the future by adding the ability to reorder columns in the column selection dialog.
  3. Yes, currently it is string only, however we are already working on a solution that would let us use numbers or dates there by specifying the categorization function (just like we did with dates in bar chart)
  4. At the moment it’s possible to choose different type of aggregations (on top of the tree map), but not the color scheme. When the “color” column is specified, the value that is getting color-coded is actually always the aggregated value.
  5. Thanks for bringing it up - we should probably enable all types and all possible aggregations in combo boxes, but an error should be shown when an invalid combination (such as “avg string”) is set.

Thanks Andrew. For 4, it will be nice in the future that user can choose color scheme and be able to customize color of the aggregated value. Several other viewers are also using aggregated value to color like bar chart, and histogram etc.