Hi team,
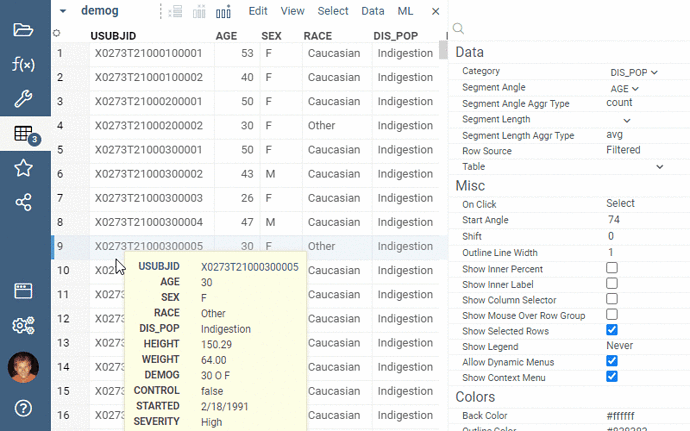
It seems like the Trellis plot is no longer allowing to configure the individual viewers (aka the second cog icon is gone):

It also seems, that switching the table for the main trellis viewer is not working, so we can’t switch to another data frame.
Hmm, it seems to work just fine on our dev version, see below. Don’t think we’ve made any changes to the trellis plot recently. You’ll have to show us to reproduce it later today 
I did notice however that docking a viewer on top of the grid causes its settings icon to disappear. We are hiding grid’s header to save the screen space; grid itself has a special settings icon in the left corner, but indeed it doesn’t work that well for other viewers that are docked this way. We’ll think of something.
it was indeed related to docking the viewer on top of a table viewer.
The remaining question is then why one can change the data table in the viewer settings (which in fact doesn’t do anything for the trellis)?


