Dear Datagrok team,
Merry Christmas!
Thank you always. It’s not urgent, but I would like to know if I could check the logs regarding how often eeach project has been opened. As far as I know, I can check the usage of packages through Usage Analysis, but I can’t find the way to check what I want to know. I wonder if you could share if there is a suitable way to investigate how many users are using the project and how frequently it is being used.
Again, this is not urgent question, so please let me know later.
Best regards,
Kosuke
1 Like
Dear Kosuke,
Merry Christmas to you too, and thank you for reaching out!
Currently, it’s not possible to view the desired information about project usage in a summarized form through Usage Analysis. If you could share your specific requirements, it would help us better tailor the dedicated dashboard we’re currently discussing.
In the meantime, you can view activity details for individual projects by navigating to Browse > Dashboards, under the Context Panel > Activity tab.
Best regards,
Olena
1 Like
Dear Olena,
Thank you for sharing current situation and how to check activity on each project.
I would like to elaborate my opinion in my mind as follows:
- I am an administrator and have access to all projects.
- For example, let’s say there are 10 projects, and 20 users have access rights to all of the projects.
- I want to know how many unique users access each project and how frequently for that (e.g. once a day, once every three days, or once a week).
- This information will give me opportunity to see which projects are attracting attention.
By understanding which projects are accessed frequently or infrequently, I believe it will provide insights on how to create attractive analysis view. Besides, user access information will give us opportunity to think how to manage/allocate user licenses efficiently.
Best regards,
Kosuke
1 Like
Here’s the corresponding ticket
1 Like
Hi Kosuke,
I’m writing to inform you that we’ve created the first version of the Projects tab in Usage Analysis 2.4.0. Here’s how it currently looks
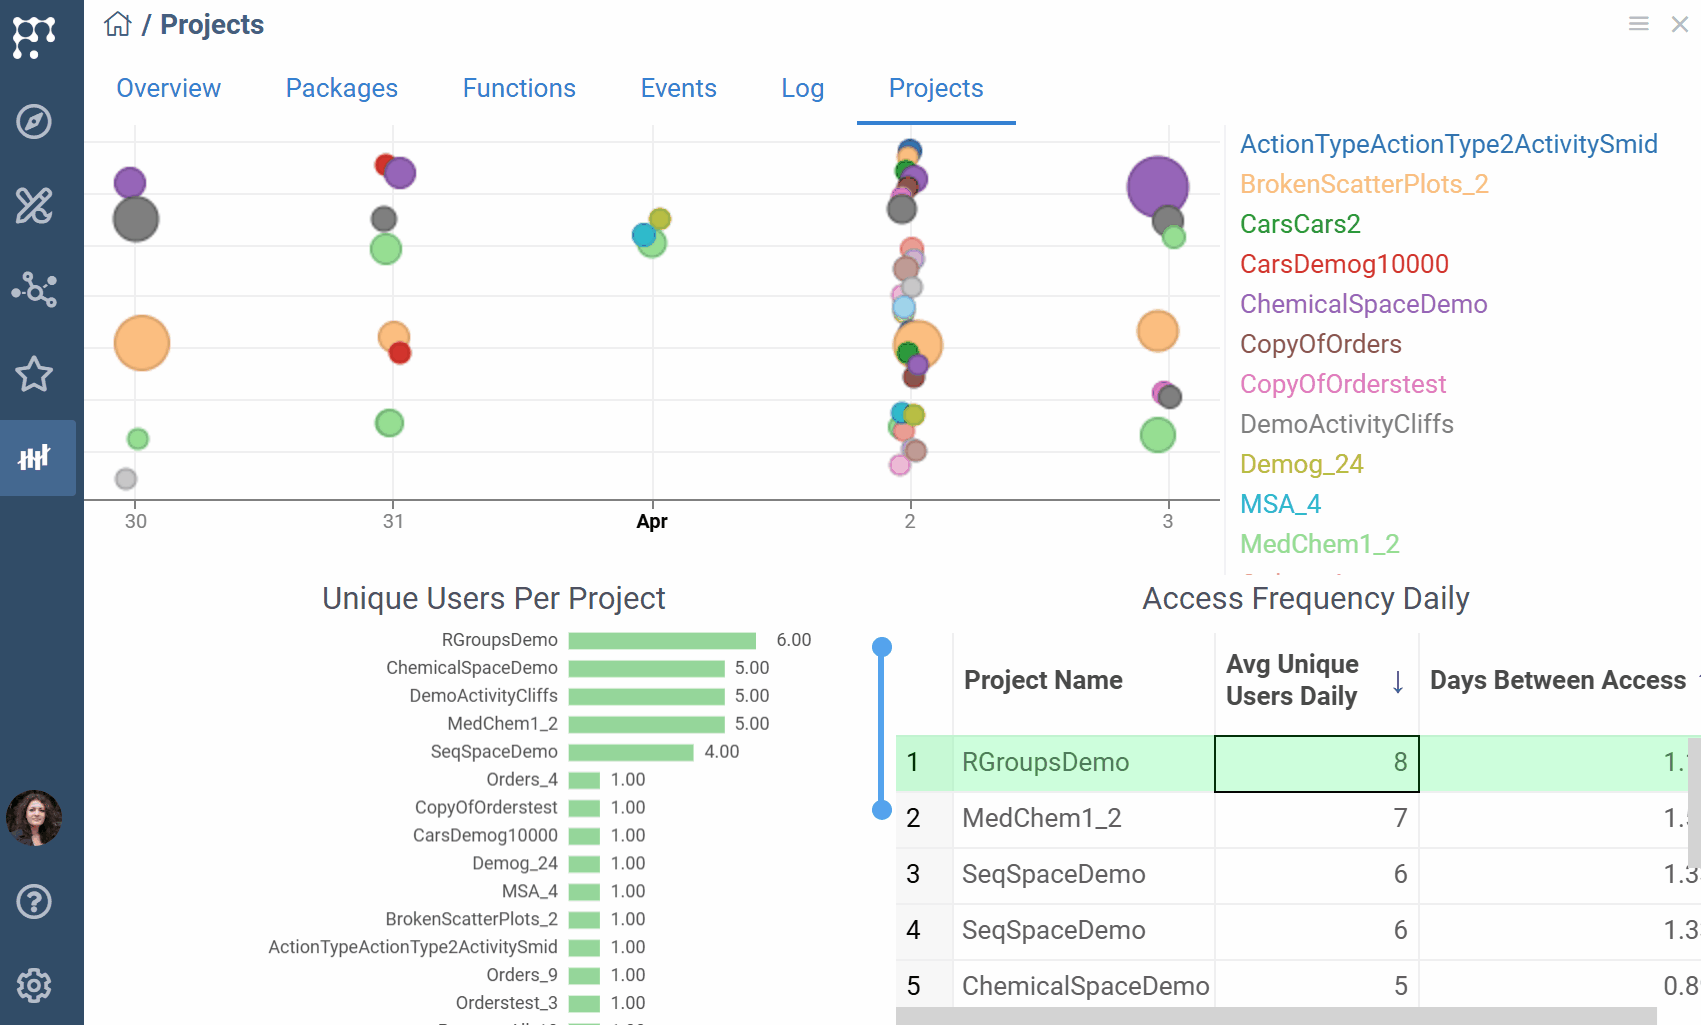
The Projects tab includes three viewers:
- Scatterplot shows a timeline of access events per project. The tooltip displays
access_count, the number of times a project was opened - Barchart displays the number of distinct users who accessed each project over the given period
- Access Frequency Daily table lists projects accessed more than once per day by at least one user:
AVG Unique Users Daily– the average number of such users per dayDays Between Access– the average time gap between project openings by different users
You can set a filter by time period, user group, and specific projects.
We would love to hear your feedback and implement suggestions you may have.
Best regards,
Olena
2 Likes
Dear Olena,
Thank you for developing the new function. I really appreciate your effort.
While this is the functionality I was looking for, I noticed something that seems a bit unusual. Based on my observation, I believe it’s NOT showing the projects that are shared to groups I belong to.
Could you please take a look at this when you have a chance? I’d be happy to provide more details if needed.
Best,
Kosuke
1 Like
Hi Kosuke,
There is a filter in Toolbox where you can filter projects by Group. Could you try adding the desired groups there and check which projects appear on the scatterplot?
Best regards,
Pavlo
1 Like
Hi Pavlo,
Thank you for your helpful explanation. Although I can use filters to set dates, groups, and projects, I still can’t find a way to display the project activities in the way I need. Could you please help me with this?
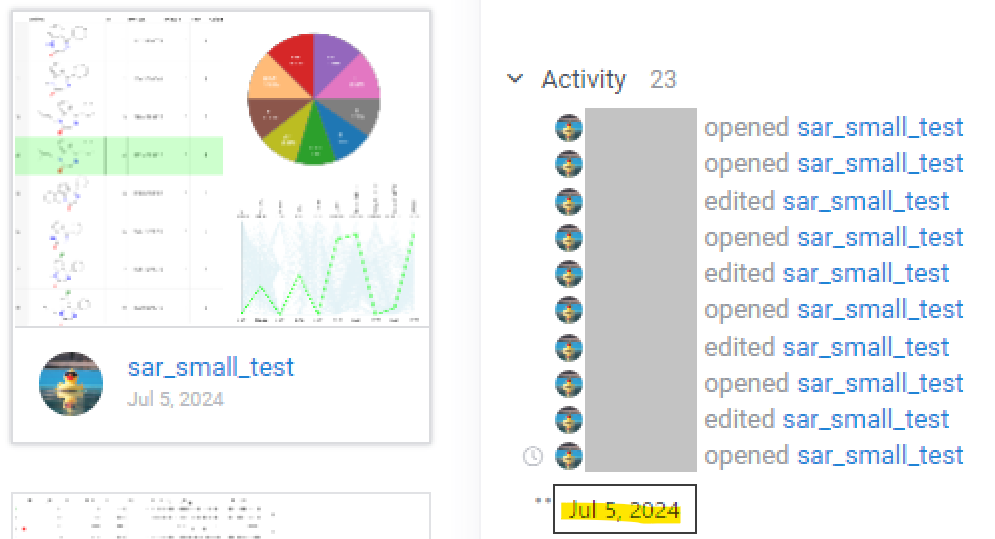
As you can see below, it’s screenshot from dashboards. For example, I’m looking at a project called “sar_small_test” and its activity is shown in the context panel. What I’d like to know is who opens this project and how frequently it is accessed (i.e. I opened it on 5th July 2024). This is a mock project for myself, but I would like to analyze a project activity which is shared with multiple members.
It would be helpful if you could let me know whether this kind of analysis is possible with the current usage analysis features, and if so, how to do it.
Best,
Kosuke
Hi Kosuke,
Currently, the best way to see who opens a project is through the Activity panel. You can also use the Access Frequency Daily table to get insights into overall usage frequency.
That said, I understand your need for more detailed information, and I’m planning to add this feature in one of the upcoming updates. Just to confirm — you’d like to see a list of users who access each project, along with how frequently each user does so, correct?
Best regards,
Pavlo
You can also use the Access Frequency Daily table to get insights into overall usage frequency.
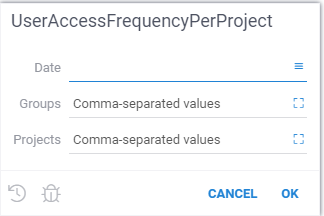
I would like to know more about Access Frequency Daily.
Do you indicate UserAccessFrequencyPerProject? Or, is there another function called access frequency daily?
Besides, thank you for confirmation about what I would like to check by monitoring datagrok usage. Actually, rather than seeing how frequently each user accesses projects per day, I’m more interested in simply knowing which users have opened each project per day (specifically, whether or not a person has accessed a project on the day, not the number of times they’ve accessed it on the day). In other words, I’m looking for a list of unique users per project per day rather than detailed frequency data. I hope this clarifies what I’m looking for.
Best,
Kosuke
1 Like
Yes, you selected the correct query. However, I was originally referring to the Access Frequency Daily table in the Projects tab of Usage Analysis.
Thanks for the clarification!
Best regards,
Pavlo
Dear Pavlo,
Thank you for your comments on this topic. Besides, I apologize for the delayed response.
I checked the Access Frequency Daily table in the Projects tab of Usage Analysis, but I noticed some discrepancies from what I expected. Allow me to ask a few more questions.
In my environment, I found that “NewProject” had the highest count, and it seems that default project names were being counted.

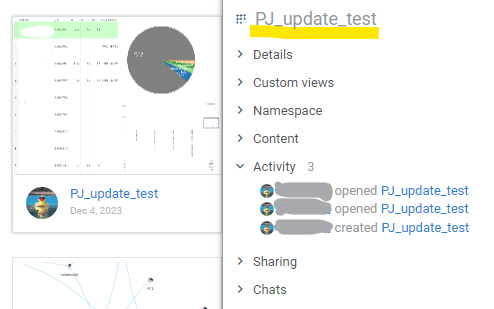
What I’m actually expecting to see is the sum of the frequency table in the Activity in the context panel. In terms of project names, this would correspond to “PJ_update_test” in the figure below.
Could you please explain what exactly is being counted as a project access frequency in the Access Frequency Daily table?
Best regards,
Kosuke
Hi Kosuke,
Thank you for your message and for reviewing the Access Frequency Daily table in the Usage Analysis section.
To answer your question: the access frequency is based on the open-project log event. This event is triggered each time a project is opened, and it serves as the indicator for project usage in our analysis.
In the current implementation, we group accesses by project name and calculate two key metrics:
- The number of unique users who accessed a project with a given name.
- The average interval (in days) between accesses to that project name.
However, as you’ve noticed, this can lead to some discrepancies. The reason is that project IDs are not always consistent over time — especially for projects that are part of packages. Each time a package is republished, a new project ID is created, even though the name stays the same. That’s why I chose to group by project name, which is typically more stable.
That said, I fully understand the confusion this may cause, especially when default names like “NewProject” are included. I’m currently working on improving the grouping logic to provide more accurate results. Specifically, I plan to group by project ID whenever possible, or use a combination of project name and associated package identifier to better track the full history of a project across versions.
Best regards,
Pavlo
2 Likes
Dear Datagrok team,
Please allow me to follow up on my previous inquiry regarding retrieving activity information for a Project.
As shown in the figure below, in the project named PJ_update_test, there is an activity history where I can see who opened it and when.
Is it possible to access this history information using the Datagrok API?
What I would like to accomplish is to retrieve a list of projects whose names contain specific keywords such as ‘SAR’, and then obtain the Activity information for each of them.
If this is feasible, please kindly let me know. I appreciate your assistance.
Best regards,
Kosuke
2 Likes
Hi Kosuke,
Yes, it’s completely possible to do everything via the Datagrok API.
To get all the projects containing specific keywords, you can use a standard SQL approach using the Datagrok API:
const projects = await grok.dapi.projects.filter('name like "%demo"').list();
This will find all the projects that start with demo - you can do a similar thing to find all the projects that contain SAR.
const projects = await grok.dapi.projects.filter('name like "%SAR%"').list();
To obtain all the Activity information for each of them, you can also use the Datagrok API like this:
const projectsLogs = await Promise.all(projects.map((project) => grok.dapi.log.where({entityId: project.id}).list()));
As you see above, you can specify the entityId as a parameter in grok.dapi.log.where, which allows you to get the activity for a specific entity (such as a project in this case).
Hope this helps!
Kind regards,
Dmytro
2 Likes
Dear Dmytro,
Thank you for your previous help on how to retrieve logs when opening a project — I really appreciated it!
I have a related question, so I hope you don’t mind me asking here.
Is it possible to retrieve logs for when the Datagrok top page is opened in a browser? What I actually want to know is not just whether a user has visited the page, but whether they are genuinely using Datagrok — for example, by analyzing data through a demo file or by dragging and dropping their own files. I believe checking logs from relevant modules might help with this.
I appreciate your help in advance.
Best regards,
Kosuke
Hi Kosuke,
Yes, this is possible. Datagrok logs several events that indicate usage - things like file-open (drag-drop or file import), project-opened, query-start, and table-produced. You can query them via:
const events = await grok.dapi.log .where({start: dayjs().subtract(30, 'day'), end: dayjs()}) .list();
Each event has .eventType.name, .eventTime, .session, and .parameters (e.g., the filename for file-open).
For click-level analysis, there’s also a click event logged for every user interaction (with the element path), which can help you see exactly what features people are using. Note that this requires the logActivity setting to be enabled per user in General settings. You can check click-level analysis in Clicks under Usage Analysis - we are also improving it right now.
Also, Usage Analysis app already covers a lot of things needed (events, functions, packages, projects) and might be also a good place to check.
Feel free to reach our for any help needed!
Kind regards,
Dmytro
1 Like
Hi Dmytro,
Thank you as always for sharing sample scripts — they are such a great help!
And wow, it’s impressive that Datagrok can log events down to the click level. That’s really powerful. I’ll definitely keep that in mind for future use.
Best regards,
Kosuke
1 Like