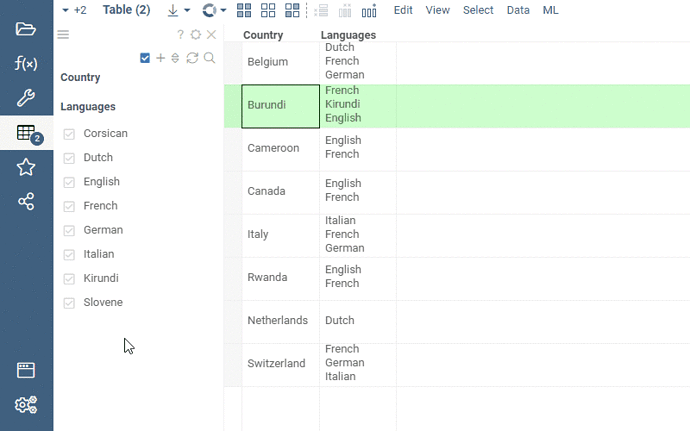
As promised, we have added filtering support for multi-value cells. In order to make the column filter appear this way, simply set the column’s tag to the value separator (you can use ‘\n’ for newline-separated values). You can do it either in the UI, or programmatically:
t.col('languages').setTag(DG.TAGS.MULTI_VALUE_SEPARATOR, '\n');
Check out the script here: https://dev.datagrok.ai/js/samples/ui/viewers/filters/multi-value-filter. A picture is worth a thousand words, and an animated picture is probably worth a bit more:
It is just a first version, and multiple improvements are already planned:
- Automatic detection of the multi-value columns based on the content
- Performance improvements
- Filter / selection / count indicators per category
@asantrosyan.gnf.org @timothy.danford.novartis.com @nikolaus.stiefl.novartis.com @andreas.gasser.novartis.com @gregori.gerebtzoff.novartis.com @nico.pulver.novartis.com @nik.clare.gmail.com
