GIS docs, release notes
GIS provides support for displaying geospatial data.
Map viewer
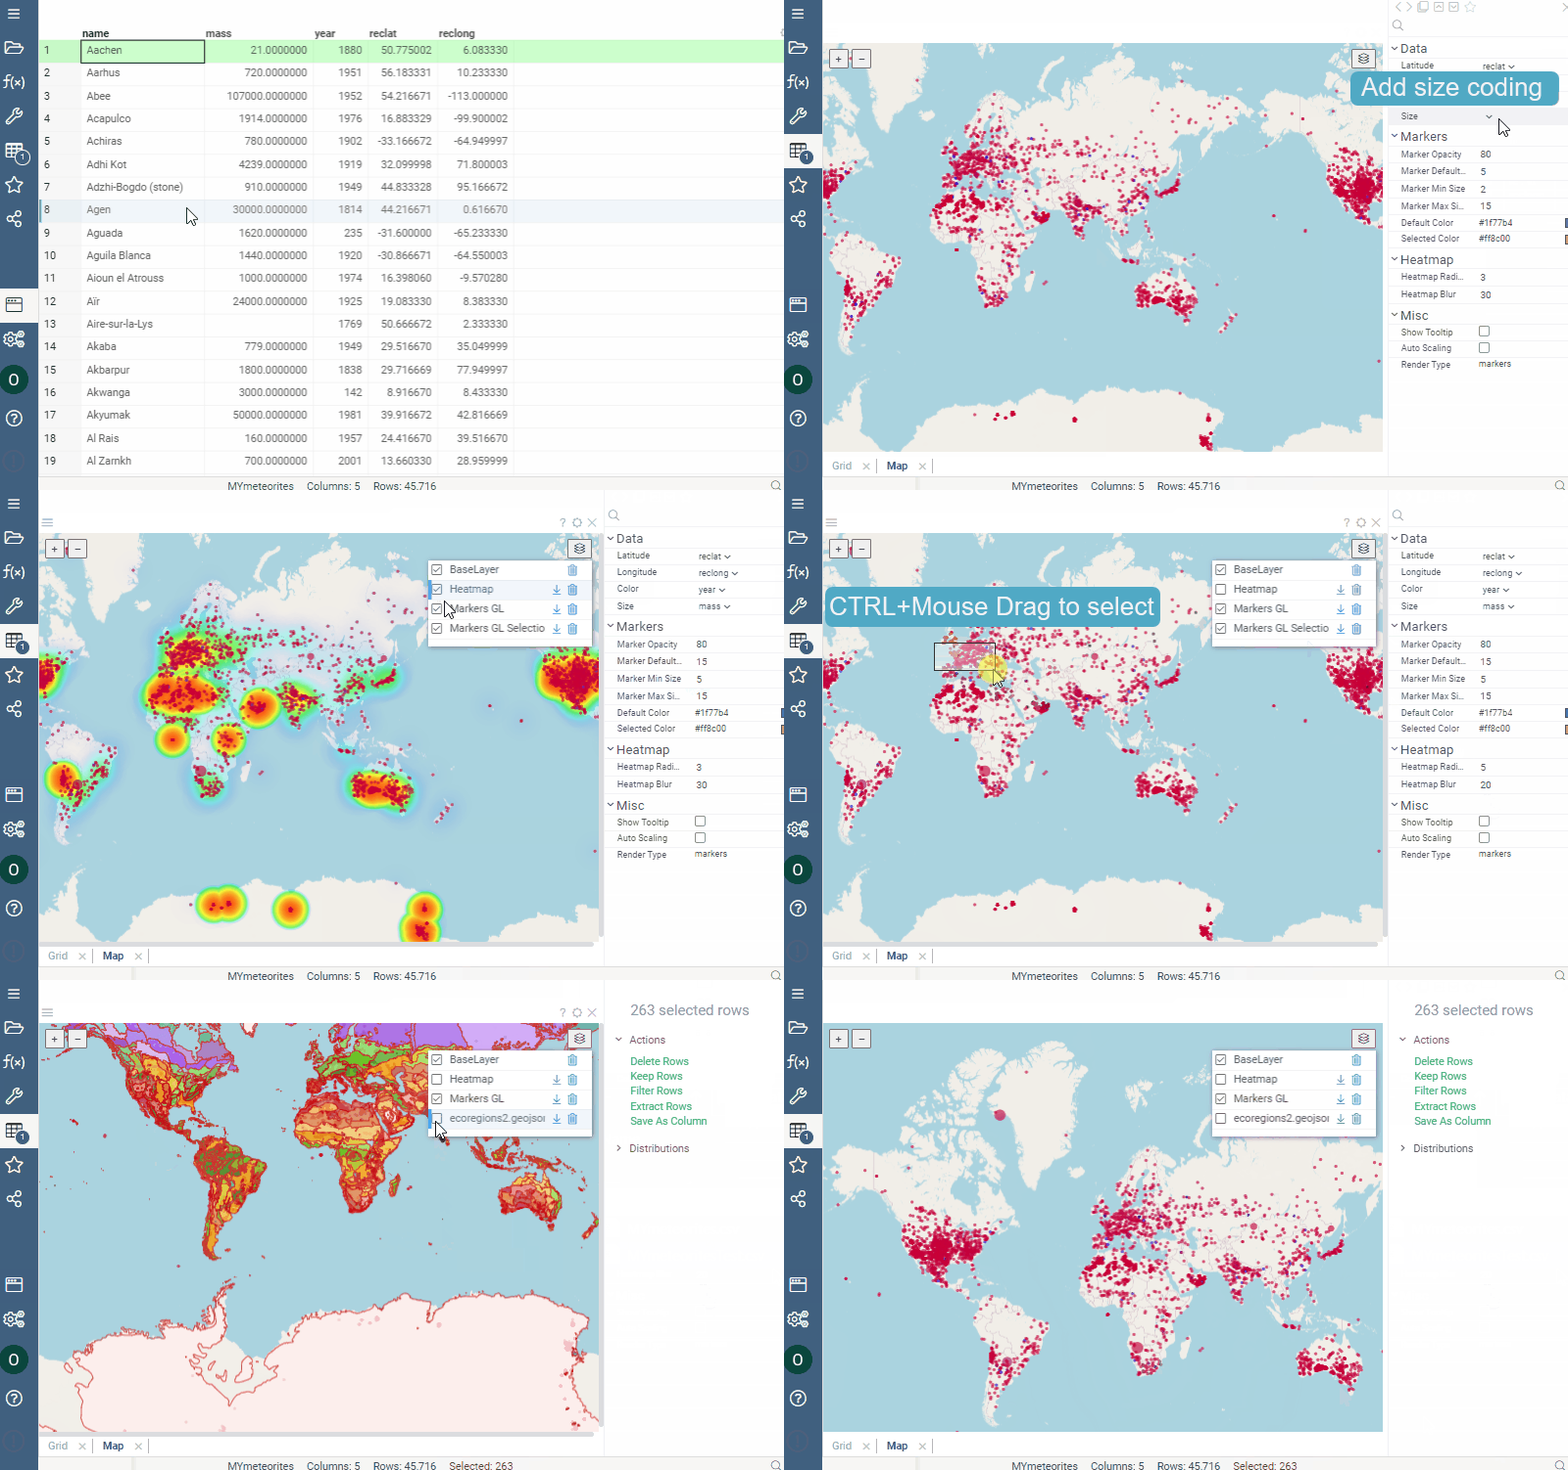
Map viewer displays geospatial data on a map as markers or heatmap.
Custom file viewers
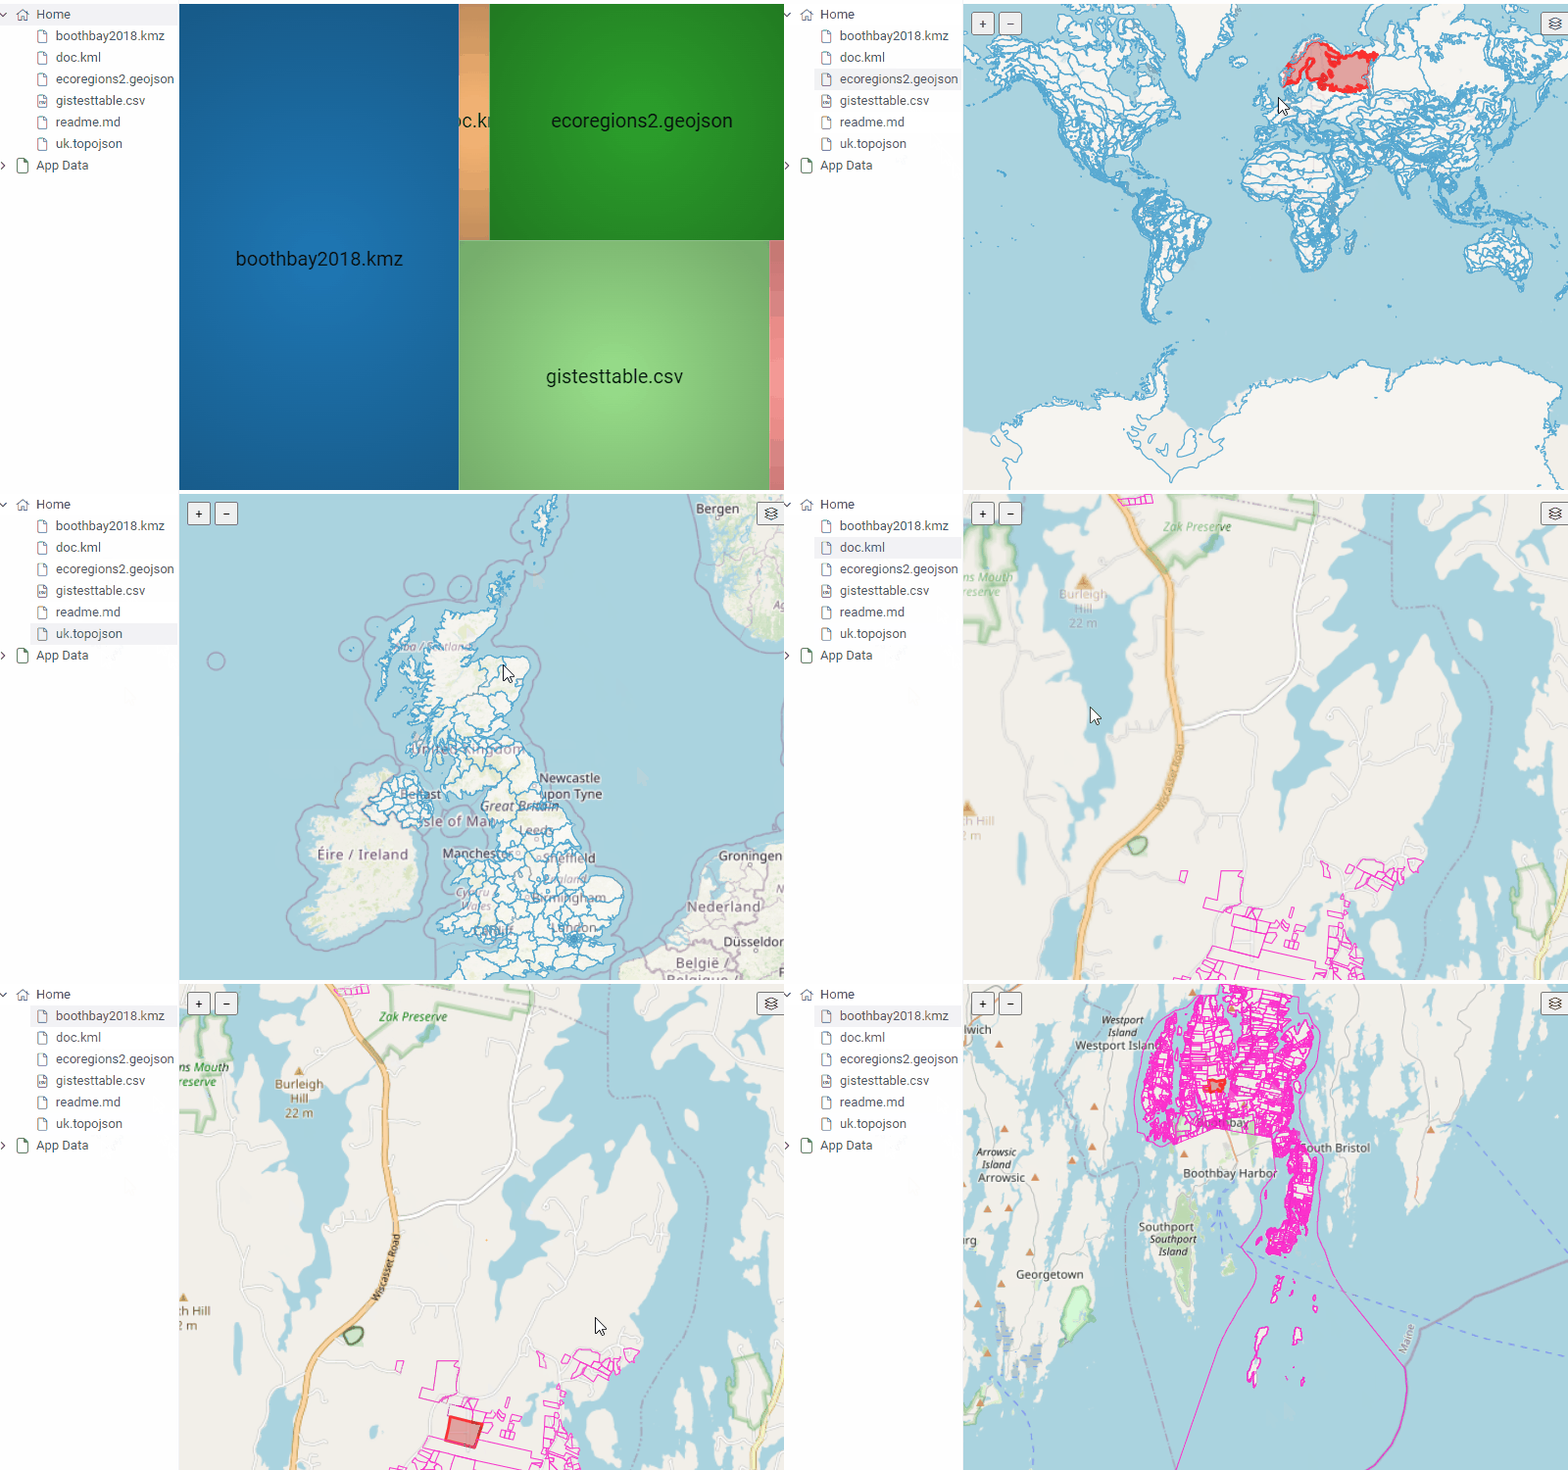
Custom file viewers allow users to view files of various geographic extensions. Supported extensions include:
- .geojson
- .topojson
- .kmz
- .kml
To view a file, navigate to Browse, locate your data, and click on the file.
1 Like
Diff Studio 1.3.0 (2025-03-29) docs
This release improves UI/UX:
- Updated Bioreactor and PK-PD models and demo applications
- Implemented the Add to Model Hub feature
2 Likes
Retrosynthesis 1.0.1 (2025-03-31) docs, release notes
Works backward from a target molecule (the desired final product) to identify simpler, commercially available starting materials and the synthetic reactions needed to reach the target. The plugin is powered by an integration with AiZynthFinder, an open-source tool for retrosynthetic planning.
To use, click or sketch a molecule, and expand the “Retrosynthesis” context panel on the right:

1 Like
CDD Vault Link 1.0.0 (2025-04-01) docs, release notes
Provides integration with CDD Vault registration system. To use the plugin, you must be registered in the CDD Vault system and have at least one vault set up.
To use the application, go to Browse panel > Apps > Chem > CDD Vault. A list of all available vaults is opened under the CDD Vault tab. Each vault contains three tabs:
- Molecules - the list of all available molecules in the vault. Id column contains links to the corresponding molecules in your vault.

- Search - basic search through your vault, containing similarity and diversity searches.

- Saved searches - open tab to see the list of all saved searches in your vault. Click any search in the list to open the search results.

There is also a tab in the Context Panel. To use, click or sketch a molecule, and expand the Databases > CDD Vault context tab :

2 Likes
NMRium 1.2.0 (2025-03-29) docs, release notes
NMRium is a file viewer for NMR data, built on top of the awesome NMRium library.
Click on the .jdx file in the browse tree, and the interactive analysis appears in the preview pane.

1 Like
Spectra Viewer docs, release notes
Spectra Viewer is a wrapper package for the Datagrok platform using chem-spectra-editor tool. Package allows preview of jdx format for various types of spectra, including IR, UV, Mass, HPLC, absorption and others.

2 Likes
BioNeMo docs, release notes
The BioNeMo plugin provides streamlined access to cutting-edge AI models from NVIDIA’s BioNeMo framework, enabling advanced protein structure prediction and molecular docking directly within your workflow.To use BioNeMo, you need an NGC API key for either cloud or local access.
Main features:
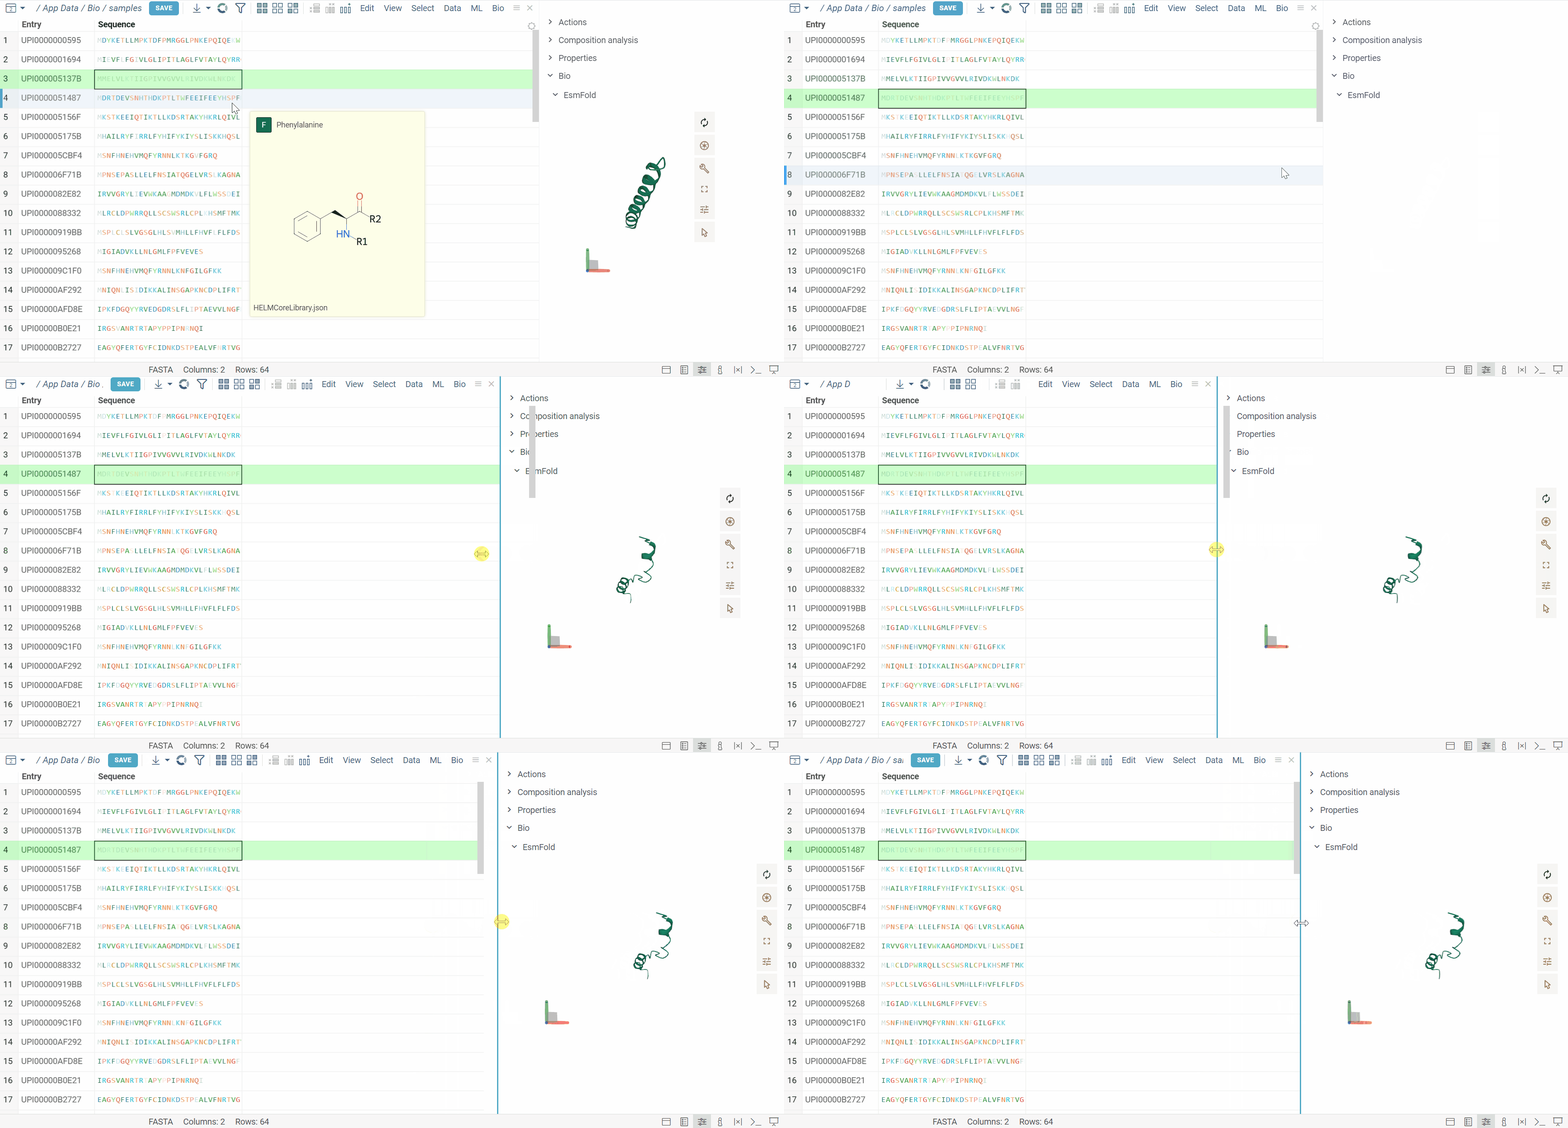
- Protein structure prediction with EsmFold
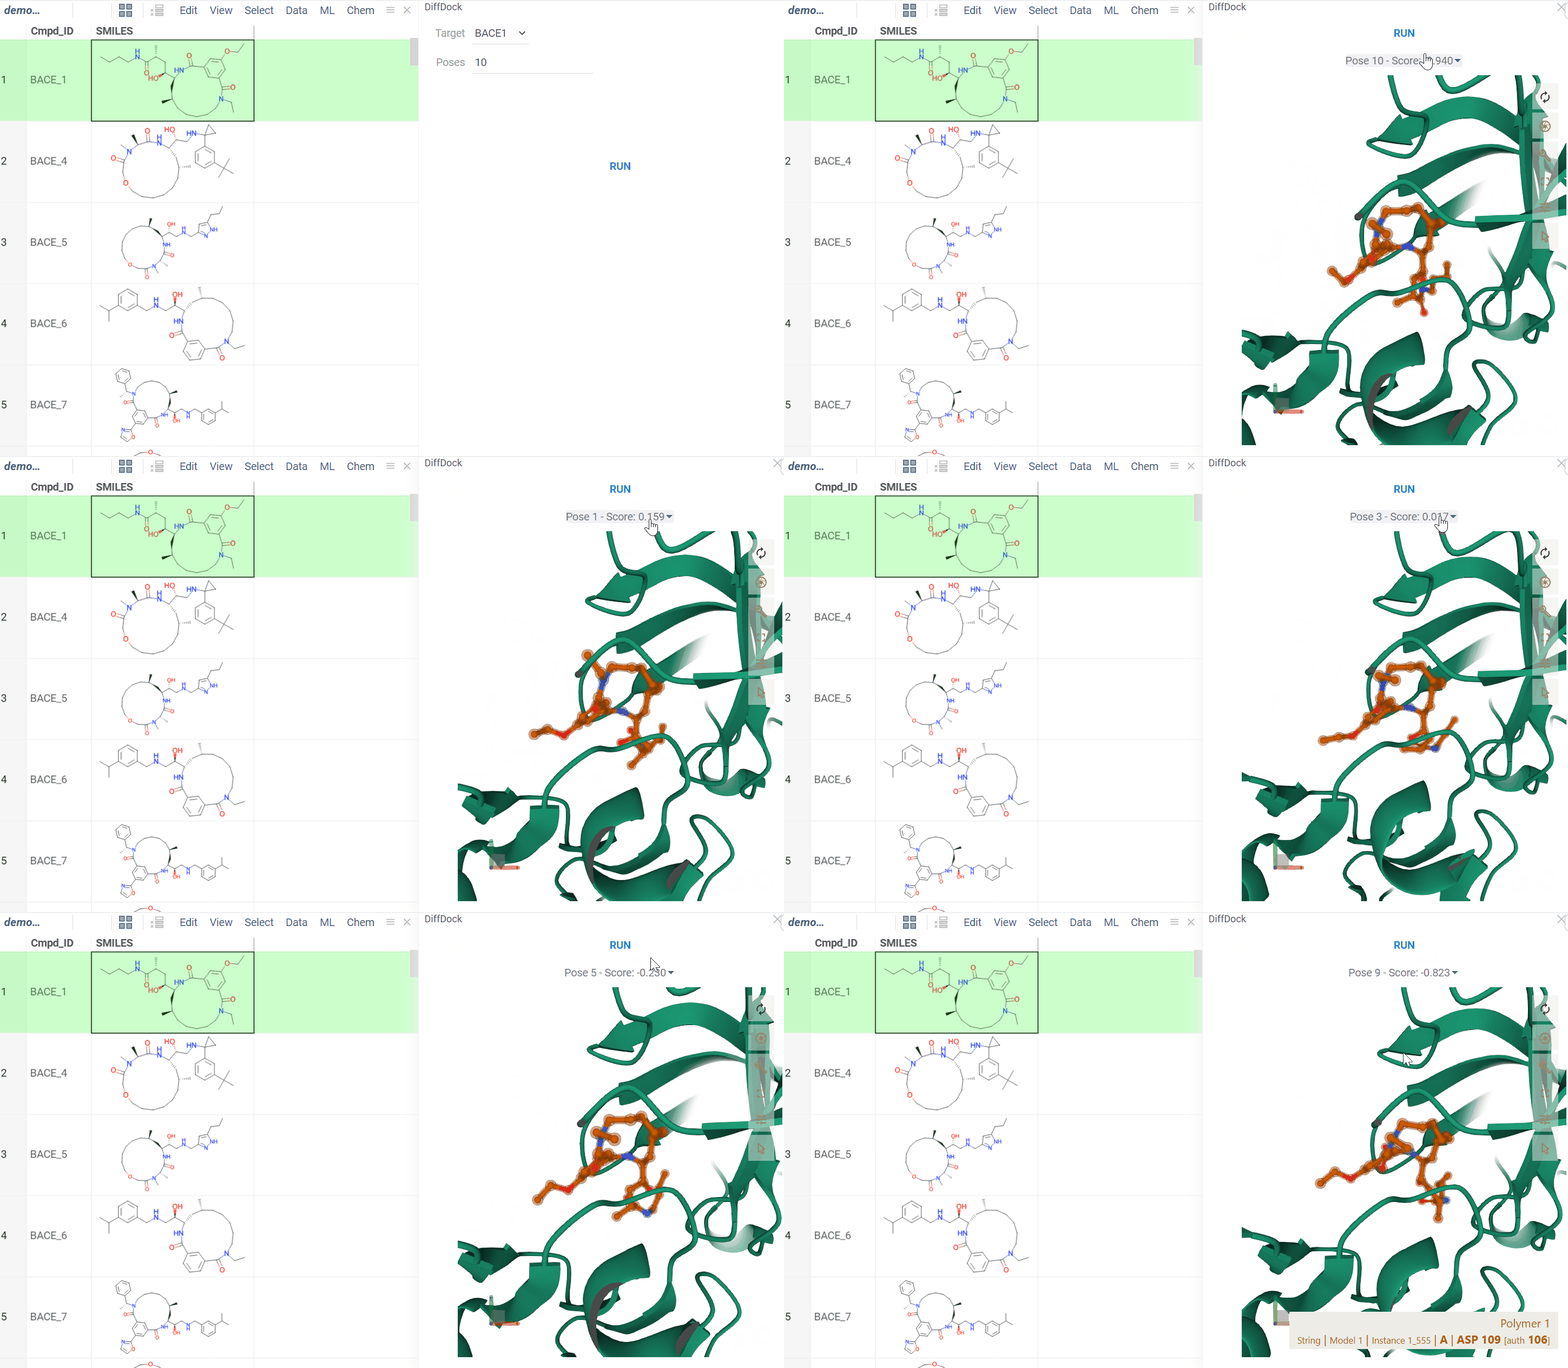
- Molecular docking with DiffDock
- Works for entire columns or individual molecules
3 Likes
Bio 2.20.3 (2025-04-01) docs, release notes
Features:
- Detectors: more sensitive for very likely column names
- Added to atomic level panel widget
- Improved Activity Cliffs demo
Bug fixes:
2 Likes
Hit Triage 1.7.0 (2025-04-01) docs, release notes
Features:
- Added caching to loaded campaigns
- Enabled parallel loading of campaigns
- Implemented lazy loading of function dialogs
- Enabled compatibility with new Browse version
Bug Fixes:
- Fixed saving issue for campaigns
- Fixed URL logic
2 Likes
Charts 1.5.1 (2025-04-01): docs, release notes
Features:
- Moved Multiplot from separate package to Charts
Bug fixes:
- 3307: Tree viewer not clickable upper node
2 Likes
Chem 1.15.0 (2025-03-29) docs, release notes
Features
- #3273: Scaffold tree: Added the ability to apply scaffold tree colors to scatterplot or other viewers
- #3314: Scaffold Tree: Demo improvements
- Scaffold Tree: Implemented the persistence of the previous hide/show state
- MMP:
- Added the ability to open the scatter plot context menu when right-clicking on the cliffs scatterplot
- Implemented separate generation of scatterplots for each activity
- Improved the Cliffs tab scatterplot
- Enhanced the trellis plot filters
- Enabled the use of column descriptions instead of custom tooltips for non-molecule columns
- Added a help URL
- Cluster MCL implementation
- Parallel beautification
2 Likes
Curves 1.6.0 - 1.8.0 docs, release notes
The latest versions of Curves bring significant performance improvements and enhanced functionality, including fitting caching, outlier handling, and support for multi-plate files. Key features also include automatic plate import from Excel, improved rendering for 1536-well plates, and integration with new plate readers like Delfia Envision and Spectramax.
Integration with assay plates
For several commonly used formats representing assay plates, Curves automatically detects layout, concentration, and activity layers and shows plate content in the form of automatically fitted dose-response curves.
While typically such functionality gets integrated into custom apps (for instance, for doing the quality control, registering experiments to ELN, etc), this is quite useful for previewing plates. In this picture, excel files are recognized as containing assay plate data, and we can see dose-response curves in the file preview.

Plate readers
The package provides support for some of the common plate formats produced by instruments, such as BMG Pherastar, Delfia Envision, and Spectramax. The detection / parsing mechanism is extensible, so you can easily write your own reader - see examples.

2 Likes
Retrosynthesis 1.0.4 (2025-04-07) docs, release notes
- Removed the Retrosynthesis function from the Top Menu
2 Likes
Hit Triage 1.7.2 (2025-04-09) docs, release notes
- Added the ability to reorder/hide functions in the new template or functions dialog
2 Likes
Compute 1.42.2 (2025-04-10) docs
Updated the Parameter optimization feature:
- Target columns selection
- Output curves similarity control
- Improved navigation
2 Likes
Diff Studio 1.3.3 (2025-04-10) docs
This release improves parameters optimization:
- Updated output curves similarity control
- Implemented target function columns selection
- Added the navigation panel and the progress indication bar
2 Likes
Biostructure Viewer 1.4.1 (2025-04-01) docs, release notes
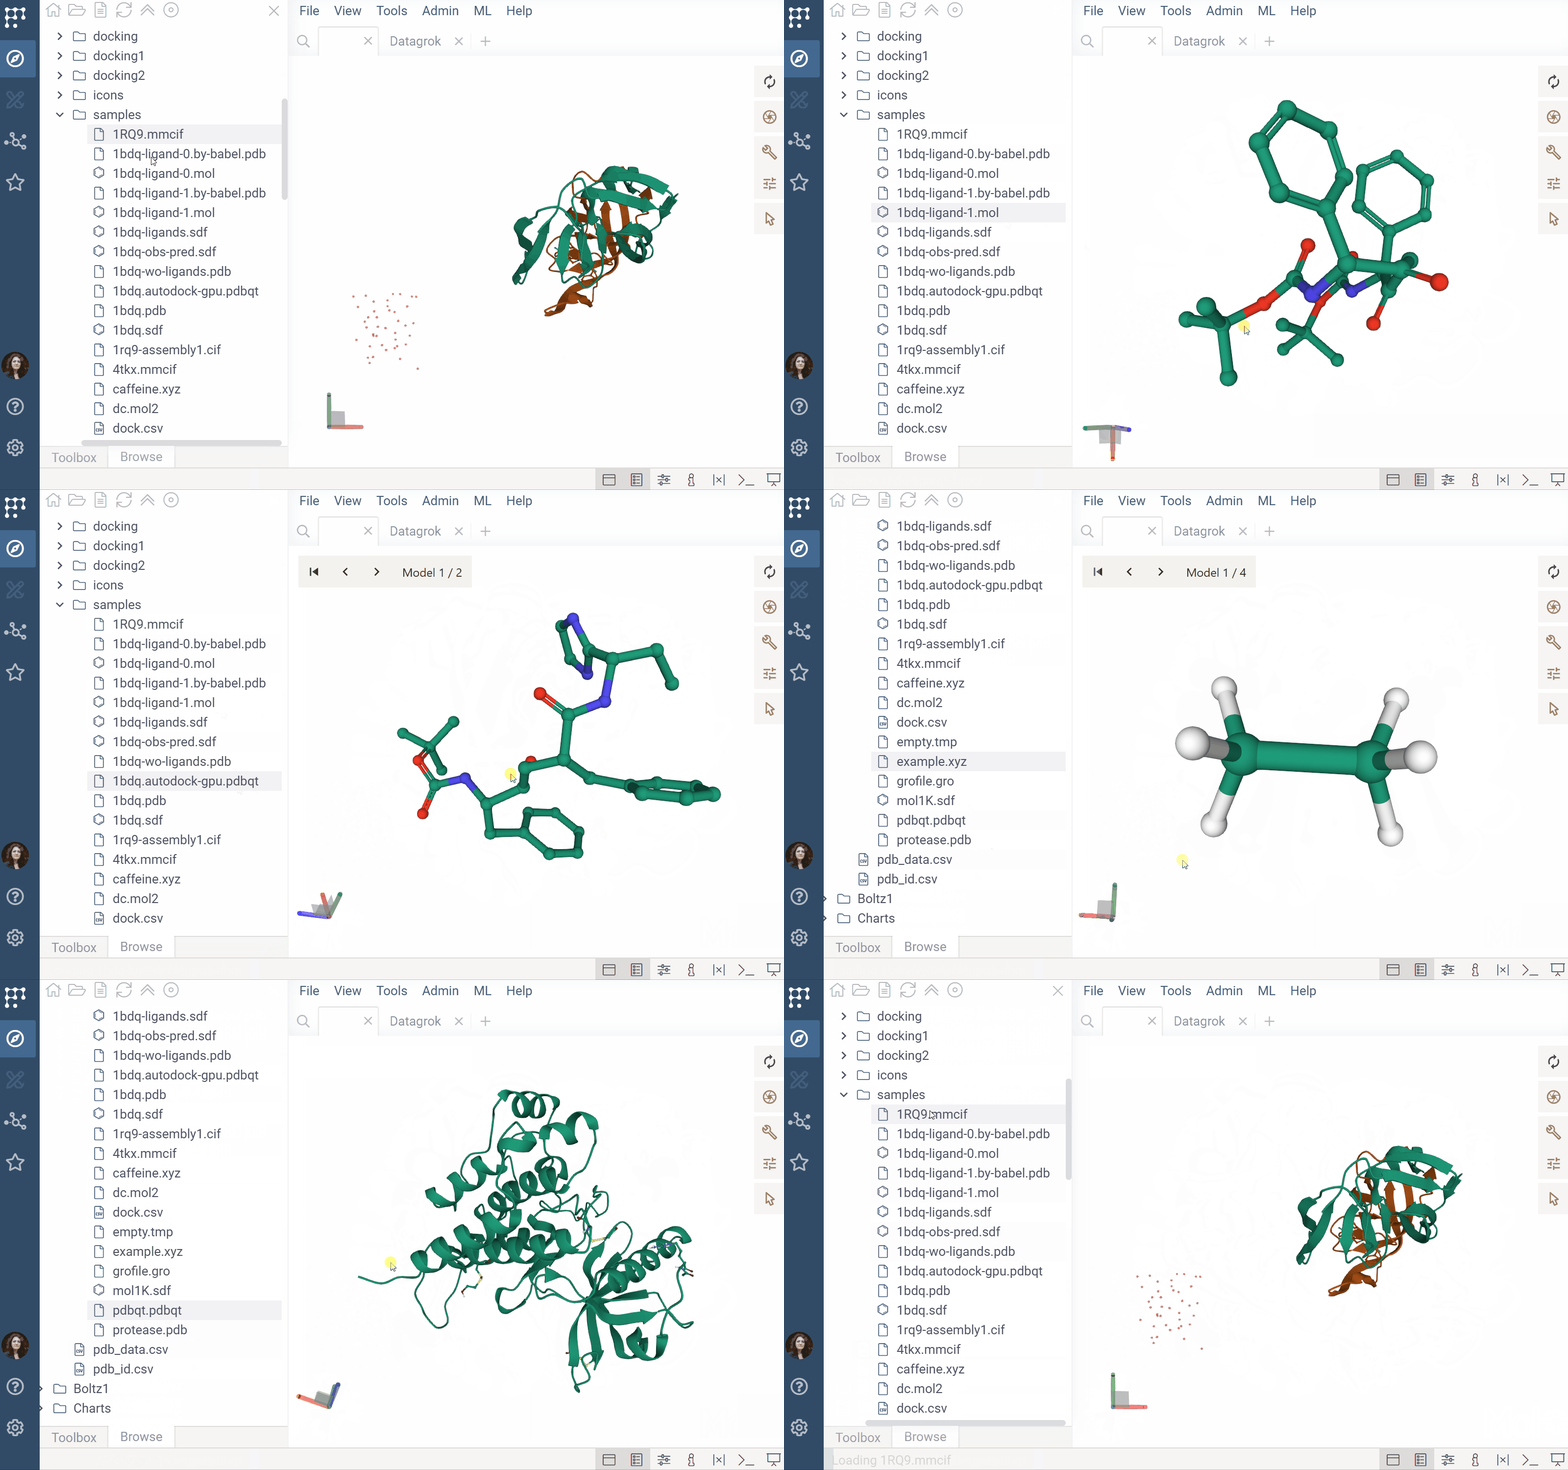
The Biostructure Viewer plugin enables visualization and interaction with molecular structures and density volumes in Datagrok. It supports Molecule3D semantic types and integrates seamlessly with Datagrok’s grid and file handling system.
Supported Formats
-
Molecular structures: mmCIF, PDB, PQR, GRO, MMTF
-
Density volumes: MRC/MAP/CCP4, DX/DXBIN, CUBE, BRIX/DSN6, XPLOR/CNS
-
Small molecules: MOL2, SDF, MOL (via the Chem package)
Key Features
- File previews & handlers: Automatically previews and opens supported files using the Biostructure Viewer
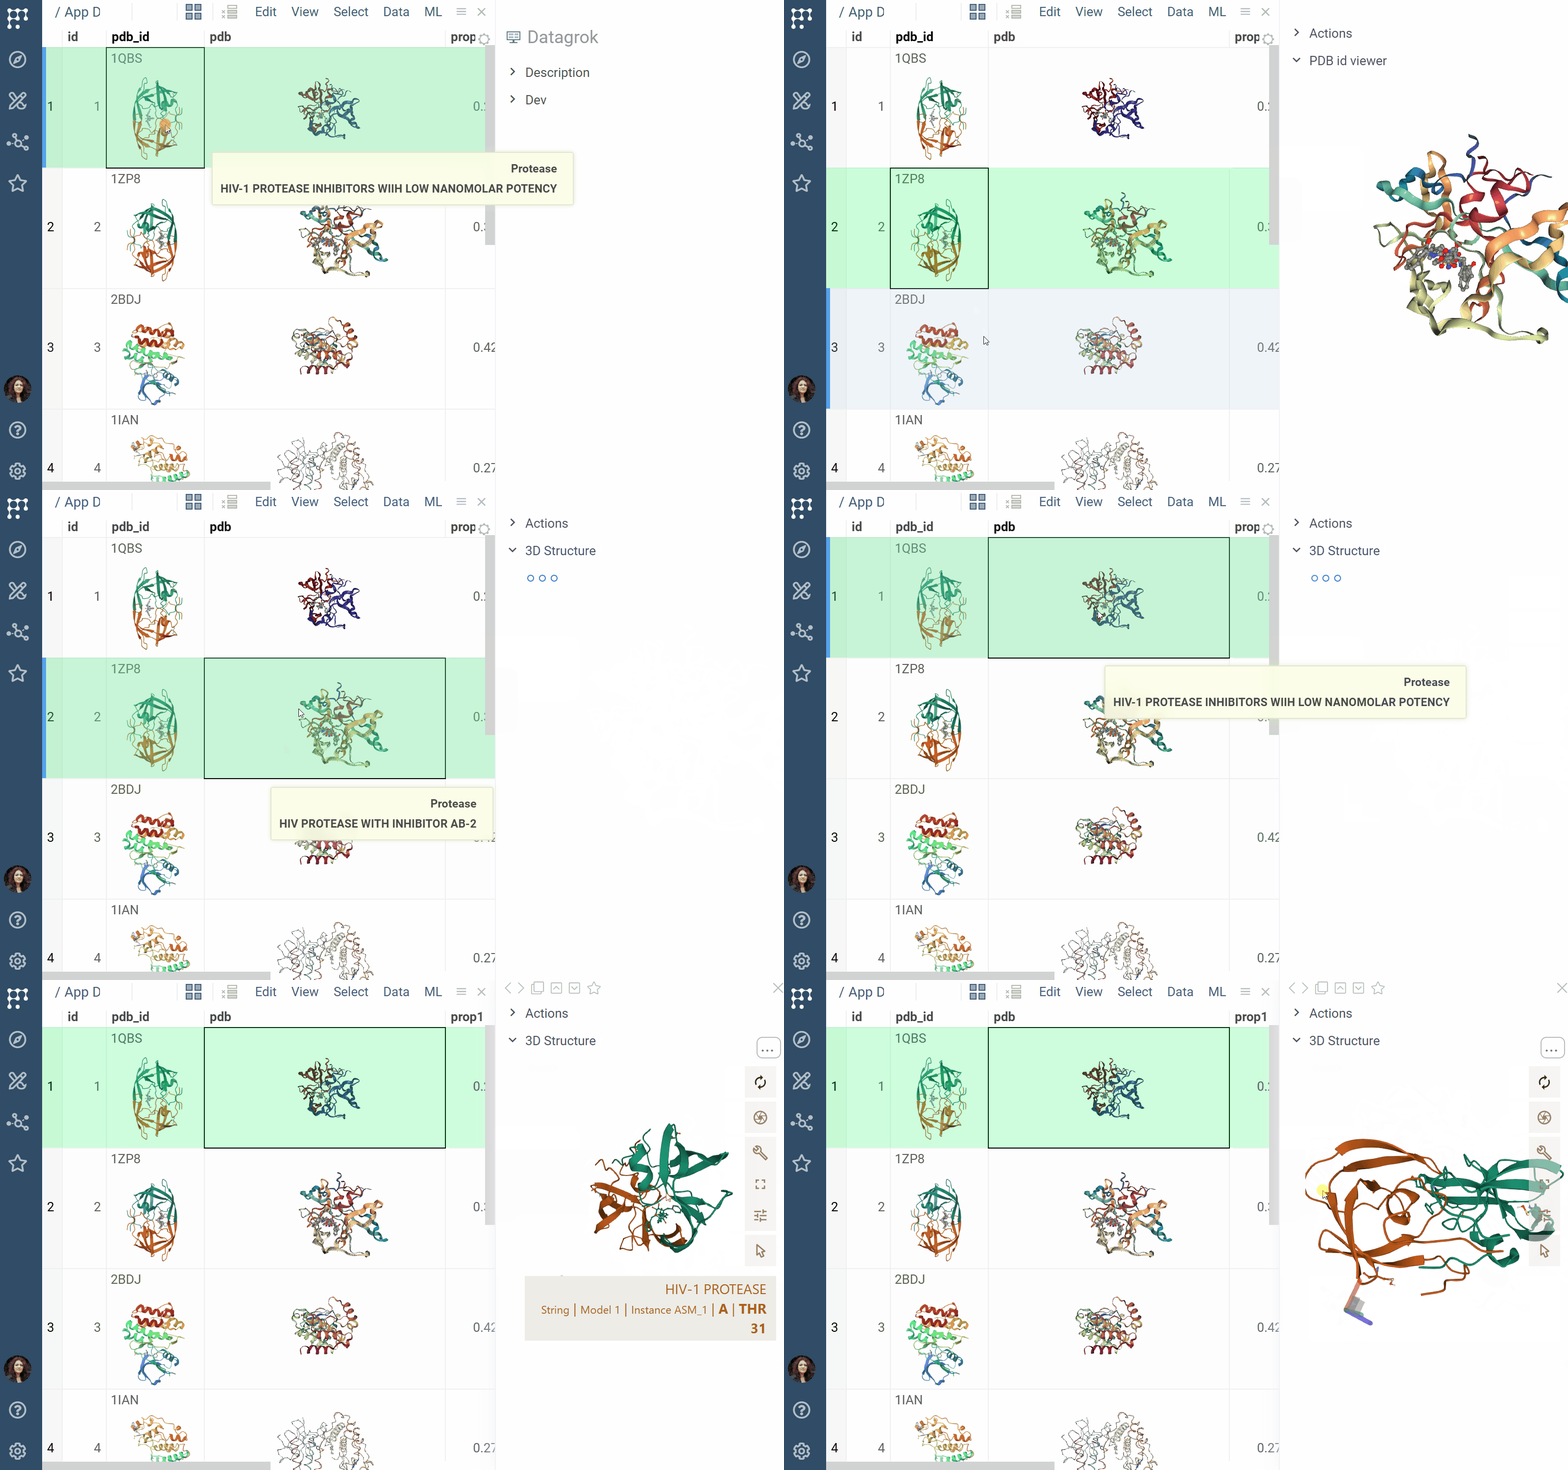
- Rendering: Columns with Molecule3D data are rendered with an NGL-based cell renderer. Clicking a cell opens the viewer to explore the structure details
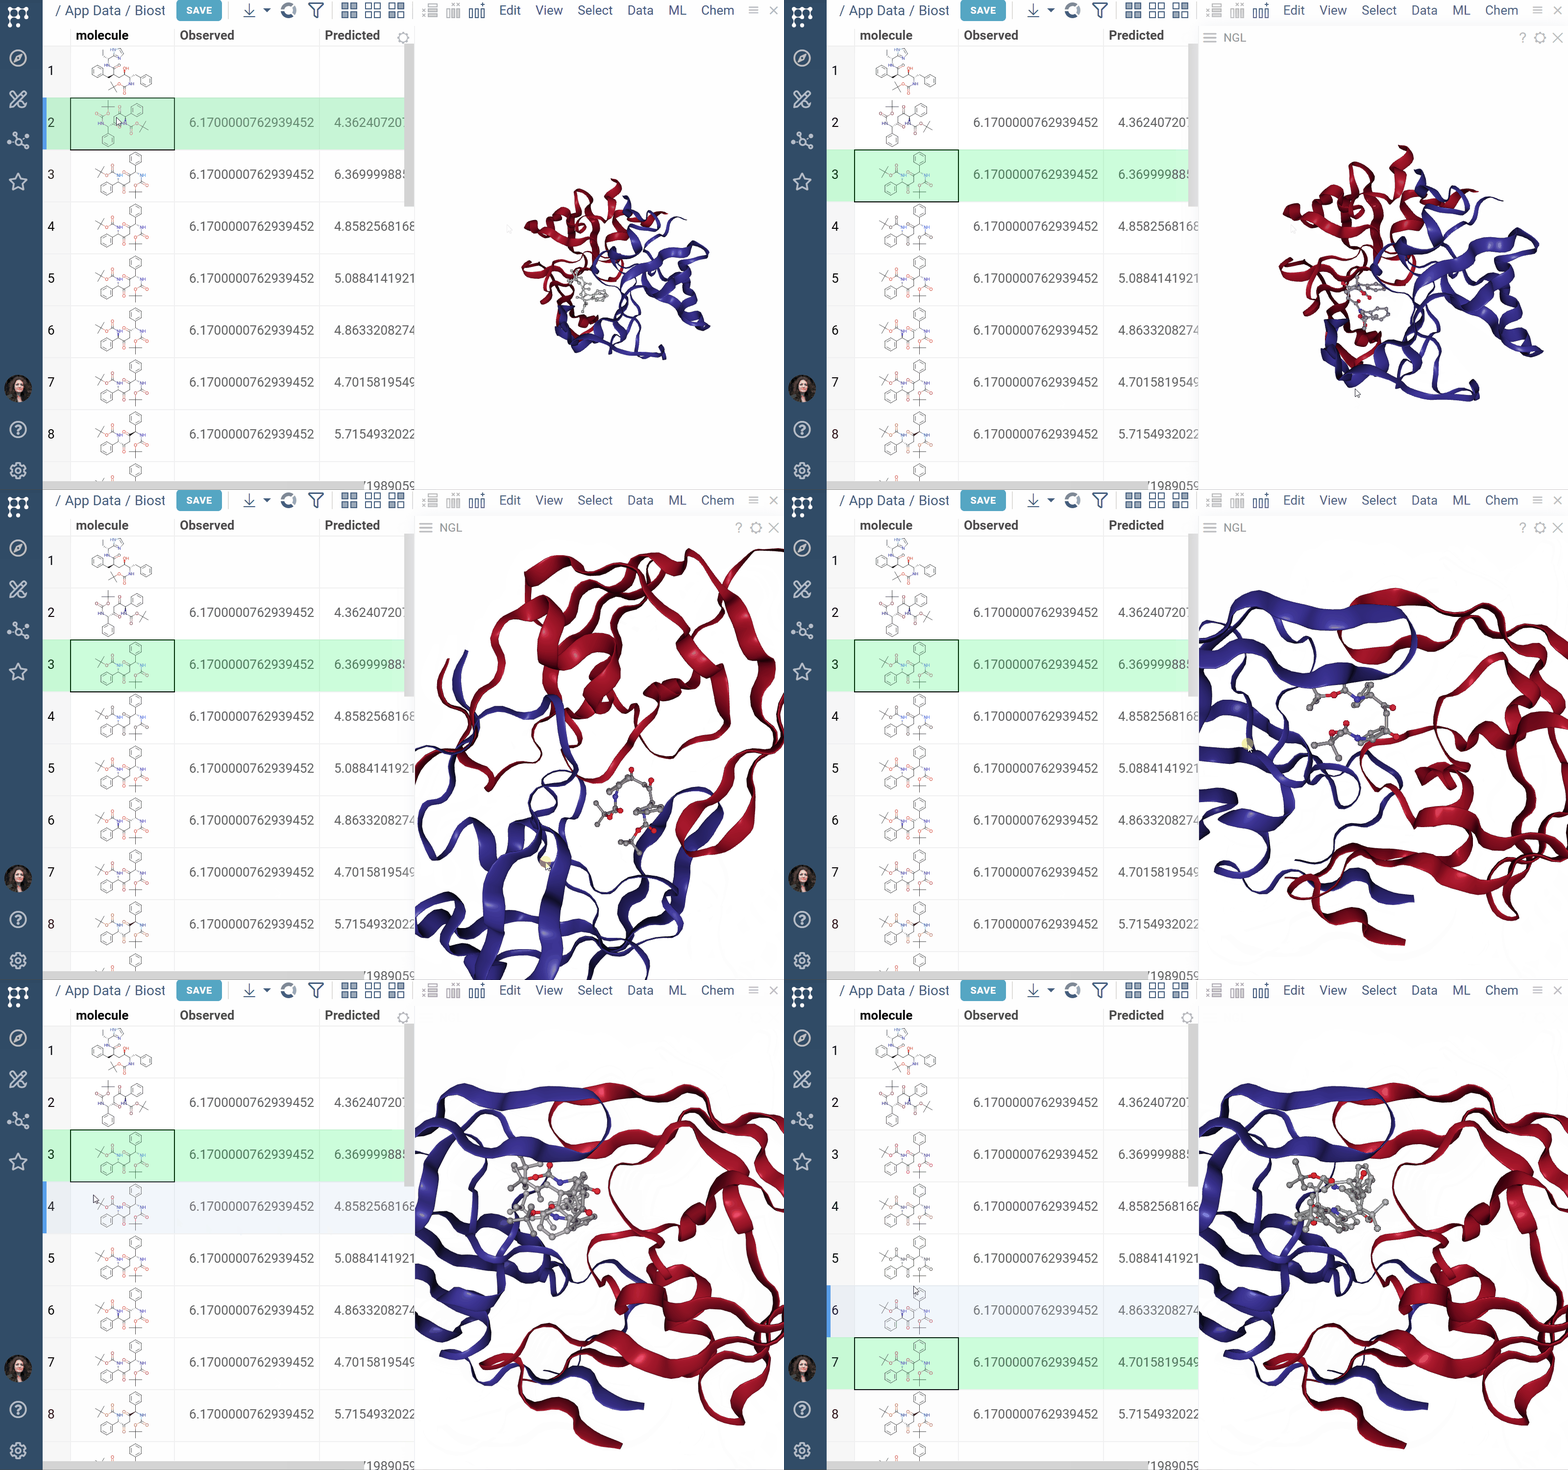
- Viewers: Both biostructure and NGL viewers use the same method to obtain structural data into the viewer from different sources (in order of priority) controlled by properties of the ‘Data’ category:
- A PDB string value of the ‘pdb’ property.
- A PDB string value of the data frame tag named ‘pdbTag’ property.
- A PDB string value of the data frame ‘.pdb’ tag in case the ‘pdbTag’ property is not specified.
3 Likes
Docking docs, release notes
The Docking plugin integrates the AutoDock GPU, enabling docking simulations of small molecules (ligands) with target macromolecules directly within the Datagrok platform.
Setup Requirements
-
Prepare the target macromolecule: Use AutoDock tools to convert your macromolecule to PDBQT format and create a grid parameter file. Place both files in System:AppData/Docking/targets/<target-name>
-
Prepare ligand data: Load or create a dataframe of ligands. You can also use demo data from System:AppData/Docking/demo_files
Docking workflow
-
Go to Chem > Docking > Autodock. A dialog appears.
-
In the dialog:
-
Select the ligands column from your dataframe.
-
Choose a target folder with docking files.
-
Set the number of conformations to explore.
-
Run the simulation. Initial grid setup may take up to a minute; results are cached for faster reruns.

- Analyze results:
-
View docking poses and free energy values.
-
Zoom into binding pockets via the Molstar viewer.
-
Explore calculated properties for deeper analysis.

2 Likes
Bio 2.21.0 (2025-04-14) docs, release notes
Features:
- Moved separator refinement to the seq-handler stage
- Added support for rendering macromolecule differences using custom notation
- Improved OCL mol converter with non-blocking behavior
Bug fixes:
- Fixed linearization, wrong R-groups, and notation problems for toAtomicLevel
2 Likes
HELM 2.10.0 (2025-04-14) docs, release notes
- Implemented Non-Drawing HWE for faster pseudo-molfile retrieval
2 Likes


