Charts 1.4.3 (2025-01-30): docs, release notes
Features
- #3221: Tree: Improvements:
- Display row counts for each branch
- Allow selection of sets in each branch to be either filtered or selected in the grid
- Enable font size customization
- Fix issue where the last-level categories are not readable in horizontal view
- Add a setting to hide null values
- Support structure rendering
- Use standard tooltips
Bug Fixes
- GROK-17376: Charts | Tree: “NaN.floor()” error while changing Color in properties
- GROK-17405: Charts | Tree: Changing Size in properties caused errors
- GROK-17414: Charts | Tree: Dragging down the three causes errors
- GROK-17420: Charts | Tree: Prevent view reset when changing Symbol size, Label rotation, or Font size
- GROK-17424: Charts | Tree: Flickering structures when ShowMouseOverLine is enabled
3 Likes
Charts 1.4.4 (2025-02-27): docs, release notes
Features
- #3249: Tree: Add cross-viewer selection
Bug Fixes
- 3245: Tree: Usability issues:
- Combination “Row Source: All - On Click: Filter” works differently in several cases
- The viewer re-renders on every branch click, even when the row source remains unchanged
- Pressing ESC on the keyboard deselects rows in the table, but the highlighting remains on the viewer
- GROK-17619: Charts | Tree viewer: Symbol size changes when aggregation function is set
3 Likes
Peptides 1.21.3 (2025-02-28) docs, release notes
- MCL: Sparse matrix pruning to avoid browser crash
Earlier updates:
- Enable Project saving for SAR analysis
- Correct Sizing of mutation cliff grids
- Selection viewer restoring original grid sorting
- MCL:
- Better layout for similar size clusters
- Update MCL algorytm and add params to starting menu
- MCL viewer limiting max intercluster lines
- Monomers:
- Add Monomer meta columns to the Monomer-Position viewer
- Color monomer background in invariant map
- Add monomer custom coloring
- Rename monomer position viewer to sequence variability map
1 Like
Pyodide 1.1.0 (2025-02-18) docs, release notes
A new Datagrok plugin enables Python scripts to run directly in the browser using Pyodide. It allows users to create dynamic dashboards with Python-powered viewers while ensuring data security, as data remains in the browser.
Check out the Pyodide presentation from Datagrok UGM for more details.
Main features:
-
Provides the ability to execute Python code directly in the browser for the Datagrok platform without client-server trips
-
Includes support of scripts vectorization for scripts with language set to pyodide
3 Likes
Curves 1.5.0 docs, release notes
-
Improved fitting algorithm: Resolved an issue where fitting was stuck within bounds
-
New Fit Functions: Added exponential and #2797 log-linear fit functions
-
#2855: Added outlier marker option
-
Changed optimizer for fitting
-
#1645: MultiCurveViewer:
- Added filter on fit columns in the MultiCurveViewer
- Made property panel fields work and made automatic chart options merge
-
#2101: Improve curves properties and rendering:
- Added tooltips on data points
- Introduced an icon for the MultiCurveViewer
- Added a
mergeSeries property and method
- Implemented legend rendering with column labels
-
#2754: Added the ability to connect points without fitting
-
#1645: MultiCurveViewer:
- Added column selection and series merging
- Added colors and fixed error messages
- Added curves limit and fixed showColumnLabel
- Disabled droplines and confidence intervals
- Standardized fit line style for 20+ curves
3 Likes
MLflow 1.0.1 (2025-02-12) docs, release notes
The MLflow Plugin for Datagrok integrates MLflow models into the Datagrok platform. It lets users fetch, manage, and run MLflow-registered models within Datagrok’s scalable infrastructure using Docker containers.
Key features:
- Model fetching: Easily access MLflow models using the MLflow connector
- Containerized execution: Deploy models in isolated Docker containers for secure and reproducible execution
- Inference API: Perform real-time predictions and visualize results within Datagrok’s interactive environment
- Version control: Access specific or latest versions of models with MLflow’s model versioning
- Environment consistency: Maintain consistent environments using MLflow’s conda or Docker specifications
- Seamless integration: Combine Datagrok’s analytics and visualization with ML model inference
Use cases:
- Perform automated model inference on large datasets within Datagrok
- Collaborate on data science workflows integrating data wrangling, visualization, and machine learning
For more details, see Using MLflow models.
3 Likes
HELM docs, release notes
Supports HELM notation (Hierarchical Editing Language for Macromolecules), enabling the encoding of complex biomolecule structures, including diverse polymers, non-natural monomers, and complex attachment points.
Main features:
- Automatic detection of HELM values in datasets
- HELM structure rendering
- Editing capabilities
- Conversion to atomic level
- Conversion to other notations (Separator / Fasta) if applicable
- Substructure and similarity searches
- Calculators (molecular weight, formula, extinction coefficient, etc.)
- Data augmentation (display relevant information in the context panel)
- Support for client-specific monomer libraries
- Monomer library management
- Similarity and diversity analyses
- HELM space visualization (UMAP or t-SNE based on chemical or molecular distance)
- Enables activity cliffs analysis to work with HELM
- Monomer tooltips on hover based on monomer library
- Support for non-linear structures
HELM 2.8.1 (2025-03-03)
- Fixed error on empty R group in HELM
3 Likes
Diff Studio 1.2.5 (2025-03-06): docs
This release accelerates the parameters optimization of multi-stage models. It applies Diff Grok pipelines to run fitting in parallel.
3 Likes
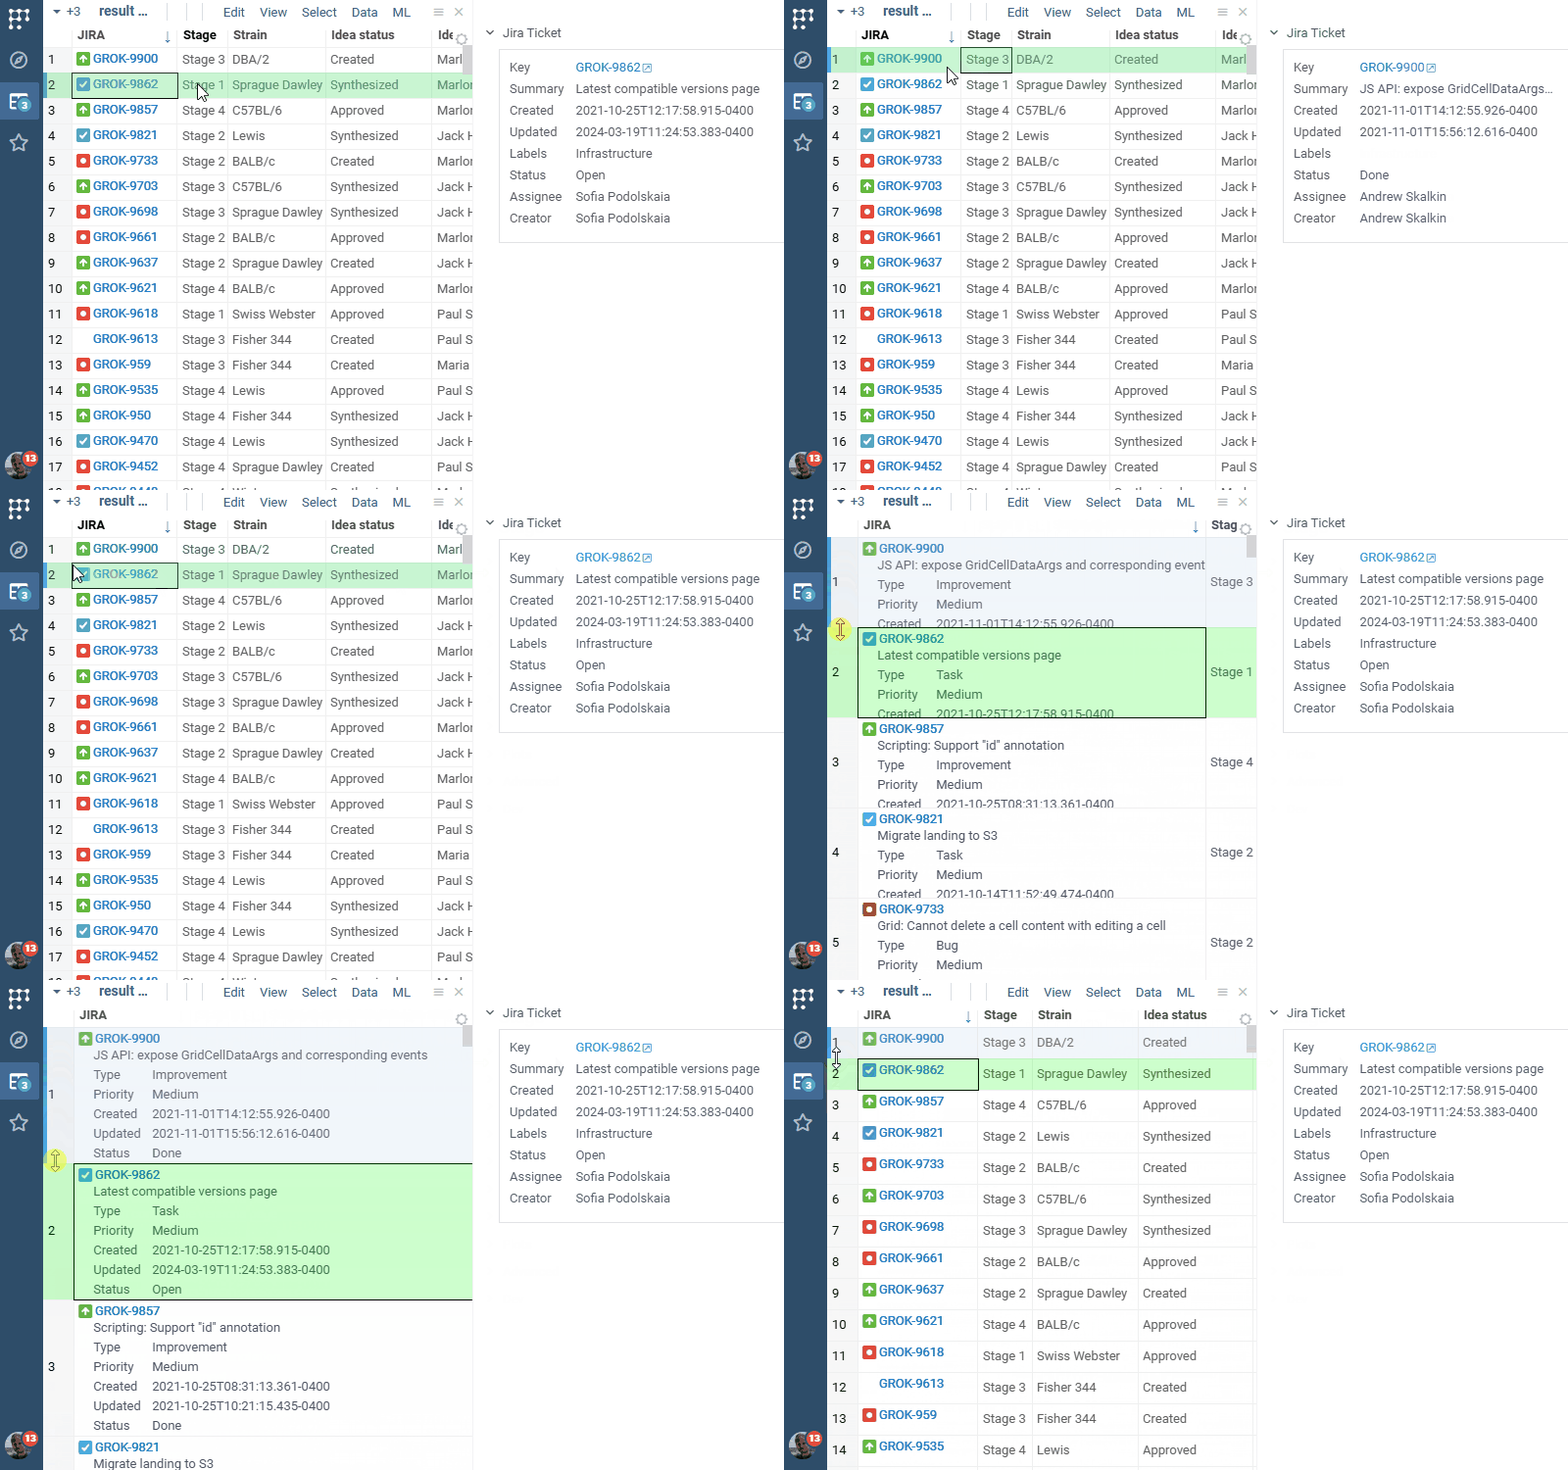
Jira Connect 1.0.0 (2025-03-06) docs, release notes
JiraConnect integrates JIRA with Datagrok. Connect to your JIRA project by providing credentials, and the rest is handled automatically:
- Recognizing ticket identifiers everywhere
- Rich visual representation
- Showing ticket details in the context panel
- Rendering details in-cell, if there is enough space
- Ability to bring additional details as a column for the whole table

2 Likes
Power Grid 1.5.4 (2025-03-03) and earlier updates docs, release notes
Pinned columns:
- Made pinned columns apply the same column header style as the standard grid
- #3229: Fixed incorrect order in pinned columns after reordering by another column
Sparklines:
- Implemented normalization for sparklines (row/column/global) with backward compatibility. For details, see Grid updates
- Enabled renderer to define context values for sparklines in the Context Panel
- Added
zeroScale to sparklines, allowing them to be based at zero or a minimum value
Grid:
- Allowed cross-origin images in canvas
- Added support for boolean columns
Vlaaivis Renderer:
- Ensured no borders or filled segments for cells smaller than 40x40
- Render only a light border
2 Likes
Power Pack 1.4.0 - 1.3.0 docs, release notes
Features:
- #2708: Formula lines: Changed “${x}” to “x”
- Widgets visibility
- Add New Column dialog: Added code mirror border when not focused
- Viewers gallery: Removed shape map
- Scrolling: Saved scrolling in tab mode
2 Likes
Chem 1.14.0 (2025-02-24) docs, release notes
Features:
- New improved MMP implementation
- Integration with Reinvent
- Copy molecule as image
- Context actions for chemical columns
Bug fixes:
- Scaffold tree: Error when uploading the saved tree
- ChemProp: Error when training a model
- Structure filter is not reset on resetting the filtering in some cases
- Filter Panel: Reset filter causes errors in some cases
- Incorrect filter UI when adding filter via ‘Use as filter’ or ‘Add filter’
- Wrong filtering when opening the project
2 Likes
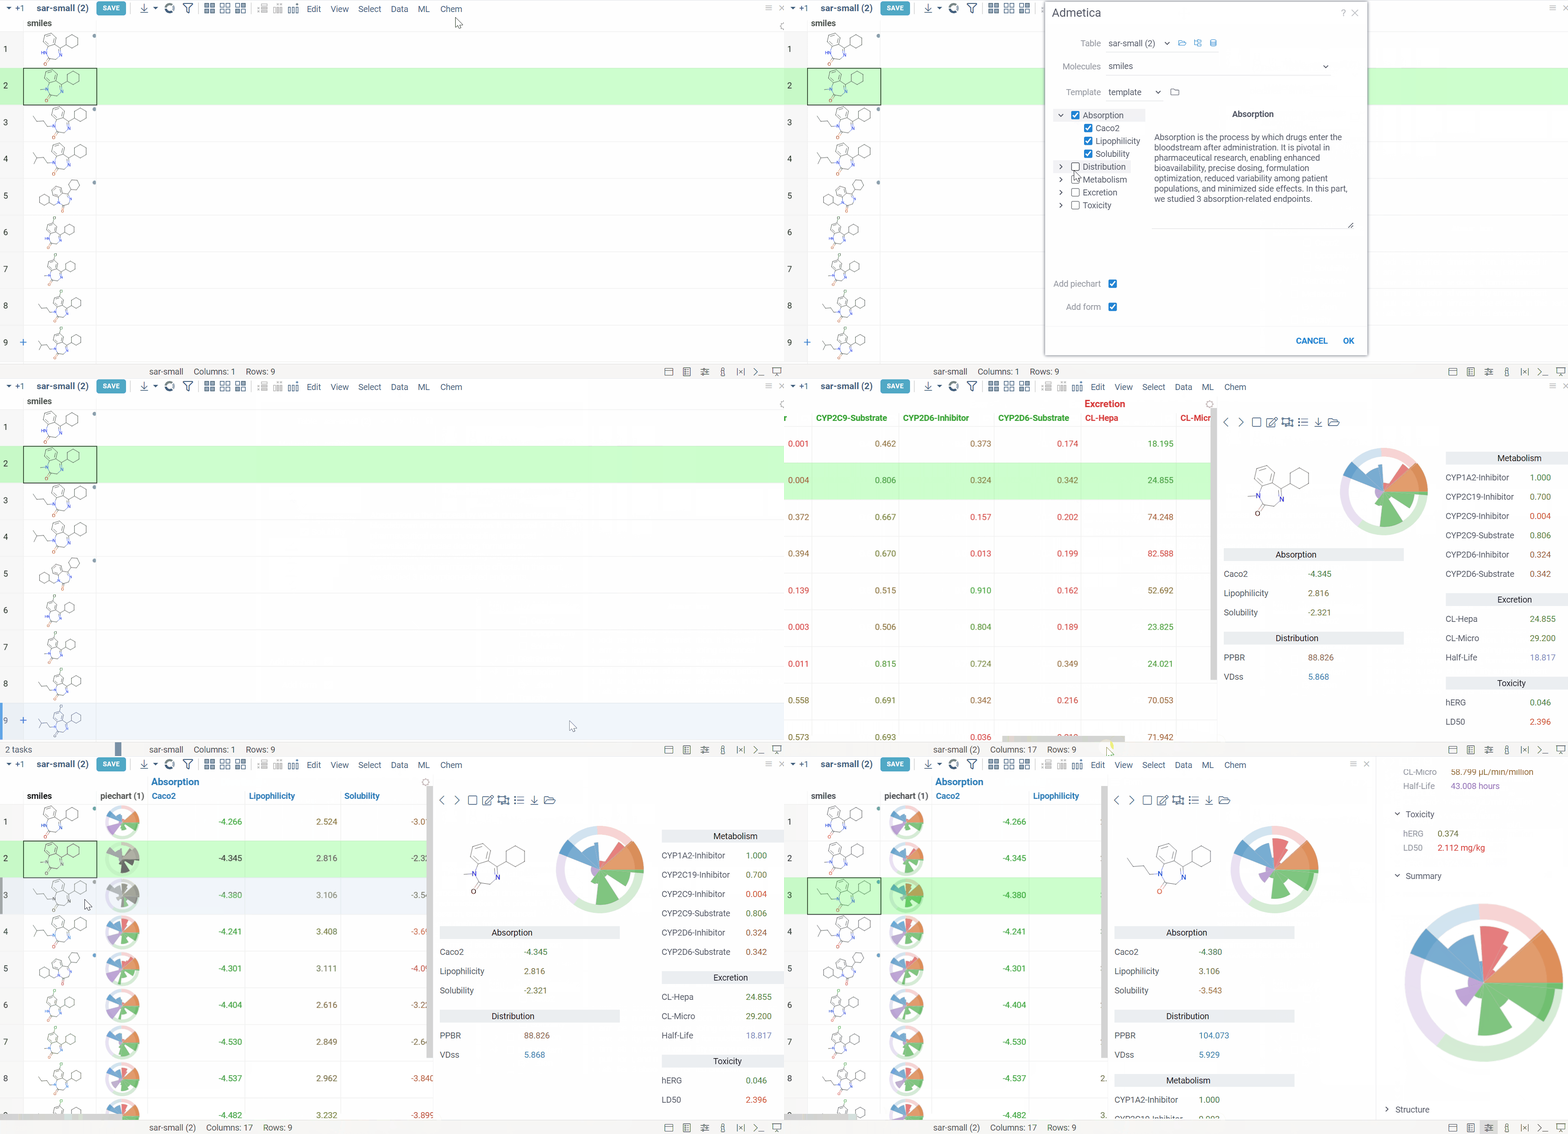
Admetica docs, release notes
The Admetica plugin brings the power of the open-source Admetica tool to your workflow, providing an efficient way to evaluate ADMET properties. This package helps researchers efficiently filter molecules and identify those that meet specific research criteria.
See it in action: Check out the Admetica presentation from the Datagrok UGM.
Main features:
- ADMET property calculation for entire columns or individual molecules
- Models aligned with the latest Chemprop v2 features
- VlaaiVis pie chart integration for intuitive data visualization
- Custom-designed form for a better workflow
- Color-coded results for clearer property analysis
- Column grouping and rule-based templates

2 Likes
Power Grid 1.5.5 (2025-03-07) docs, release notes
- GROK-17680: ImageUrl: Supported images with Datagrok paths
1 Like
ChEMBL docs, release notes
Chembl enables access to external databases like ChEmbl and UniChem while detecting custom semantic types. Beyond database queries, it leverages the RDKit cartridge for similarity and substructure searches. Additional features include a ChEMBL browser and various chemical identifier and notation converters.
ChEMBL API docs, release notes
ChemblAPI accesses external data via a RESTful API, using ChEMBL as an example. It enables similarity and substructure searches for a single molecular structure, integrating these features into the Context Panel for chemical data.
Note: ChemblAPI queries an external source, and the structure you are searching with is sent to ChEMBL as a query parameter.
SureChEMBL 1.0.0 (2025-03-10) docs, release notes
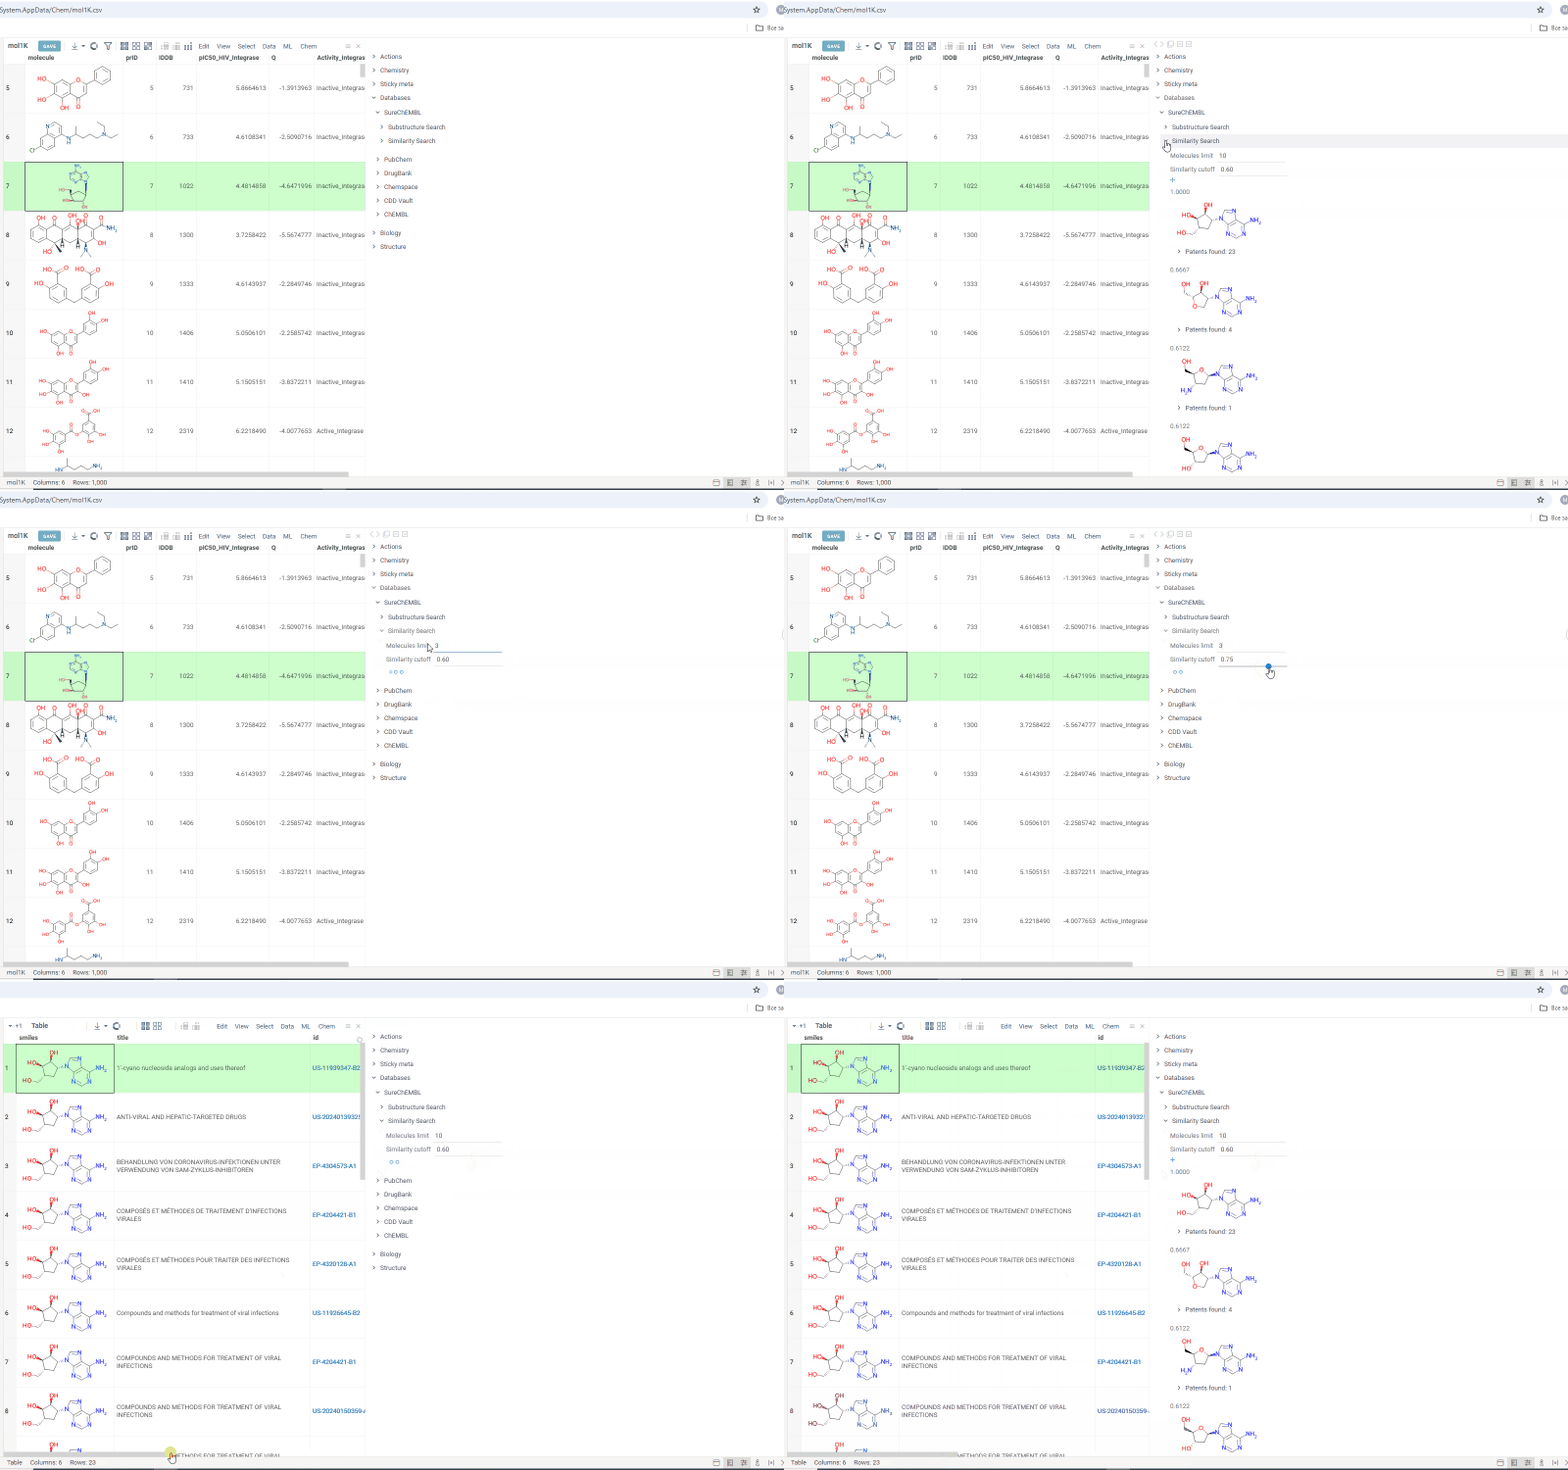
We are happy to announce a new SureChEMBL package. It allows you to search for patents through a locally deployed SureChEMBL database. The SureChembl database is deployed automatically within a docker container when the package is installed. You can search either by similarity or substructure.
To run the search:
- Select cell with molecule structure in the grid
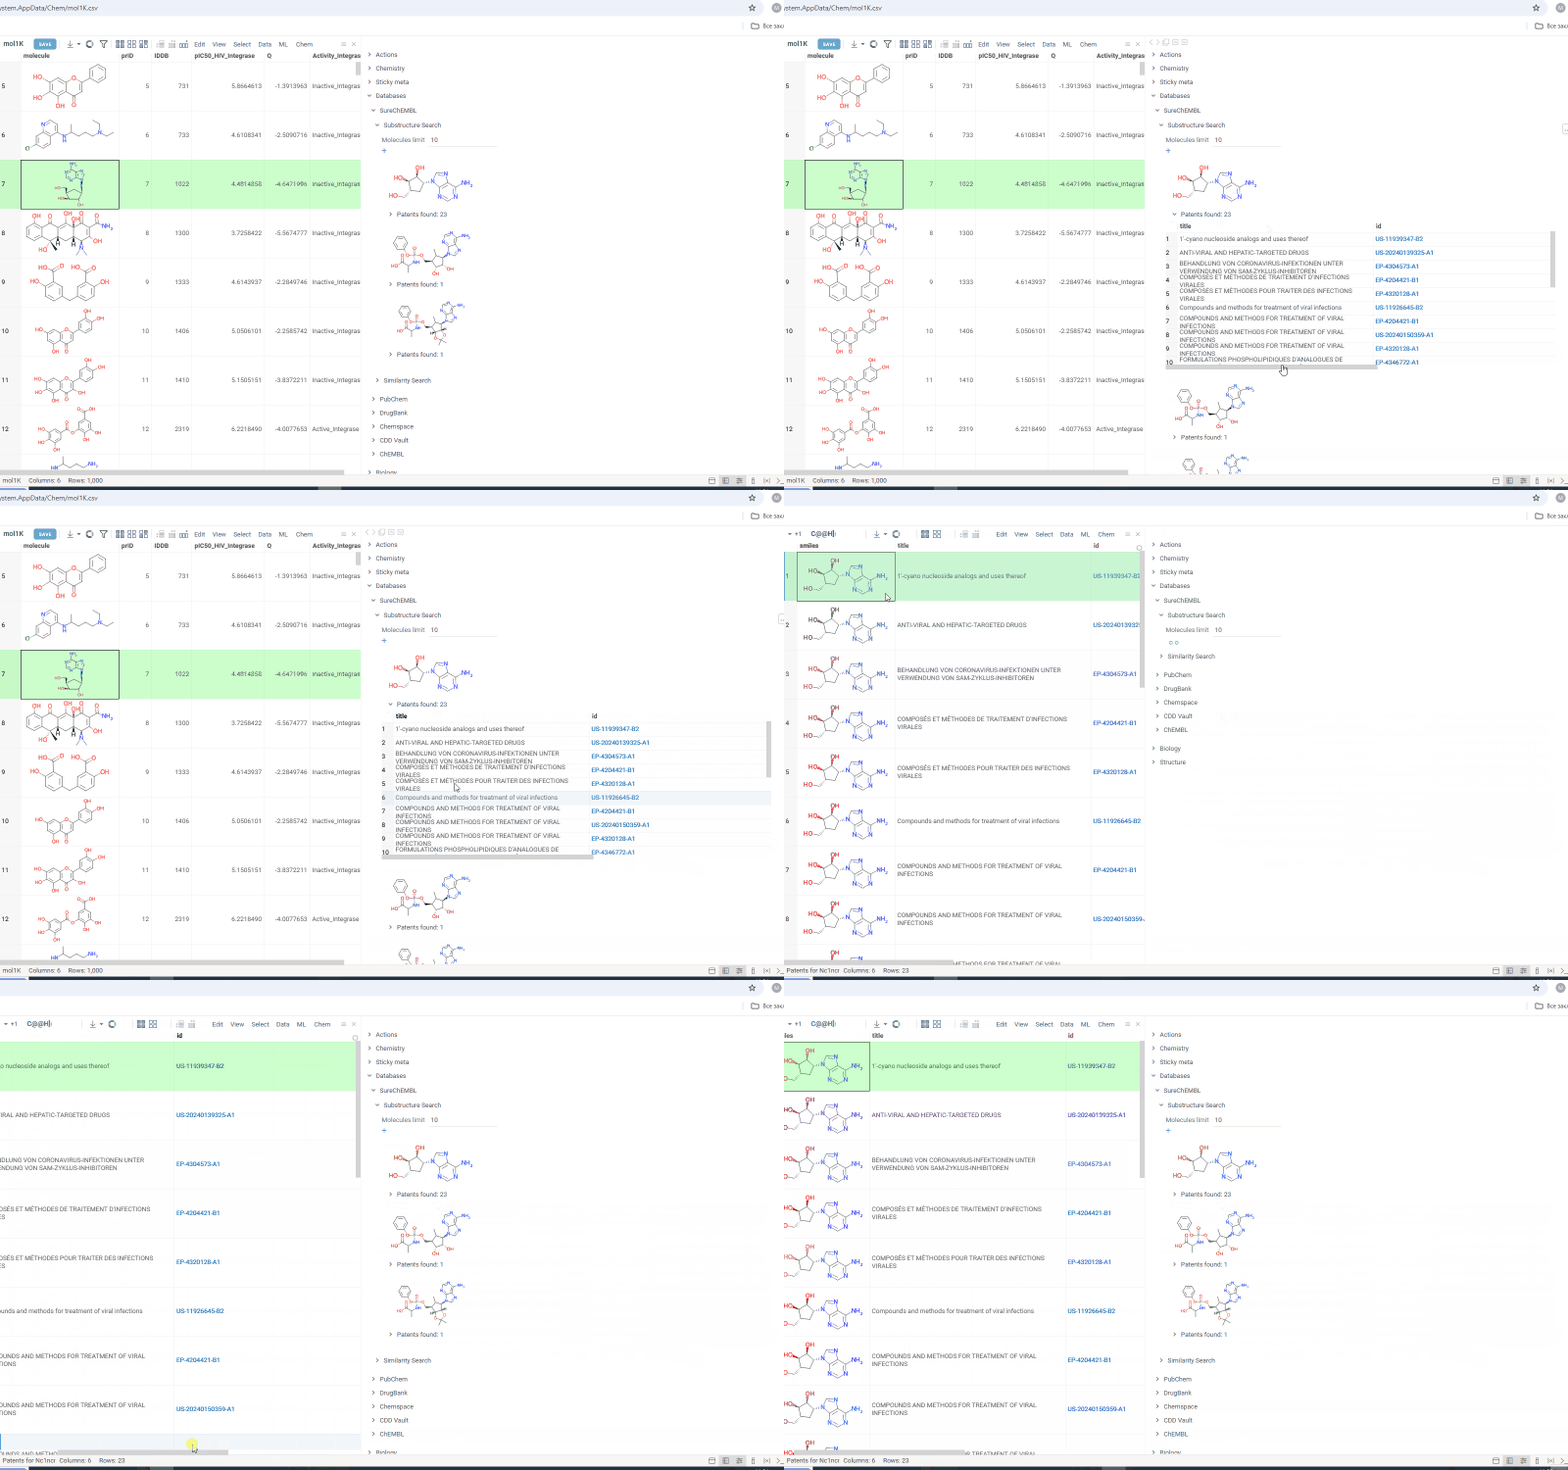
- On the Context Panel, go to Databases → SureChEMBL → Substructure Search/Similarity Search. Molecules containing the initial molecule as a substructure (or similar molecules, in case you open a similarity search) appear under the tab
- Change the number in the Molecules limit field to search for more or fewer molecules
- Change the similarity cutoff using the Similarity cutoff slider
- Click the plus icon to add all patents found for molecules in the results as a table view

Search results are shown under the Substructure Search/Similarity Search tab. Similarity search results are sorted by similarity score and the score is indicated above the molecule.
Under each molecule, there is a tab with a number indicating in how many patents this molecule has been mentioned. Open the tab to investigate patents more closely. Or hover over the tab and click plus icon to add patents to workspace as a table view. The patents grid contains several fields including id. Id filed is a link. Click on the link to go to a page with corresponding patent on a SureChEMBL resource.

1 Like
Diff Studio 1.2.6 (2025-03-10): docs
This release implements in-webworker parameter optimization for cyclic models.
2 Likes
Peptides 1.21.4 (2025-03-03) - 1.21.6 (2025-03-13) docs, release notes
Features:
- Improved mutation cliffs preview window with horizontal splitter
- The mutations groups column in the mutation cliffs pairs panel
Bug fixes:
- Corrected circle rendering in Monomer-Position viewer
- Fixed weblogo renderer with corrected colors and background corrections
- Fixed SAR errors on nulling targets
- Fixed demo and compatibility to older platform versions
1 Like
Peptides 1.22.0 (2025-03-22) docs, release notes
- Harmonized selection and counts in monomer-position and MPR viewers
- Added more comprehensive tooltips
- Improved and fixed issues in the Selection panel
- Fixed unhighlighting of the header weblogo
1 Like


