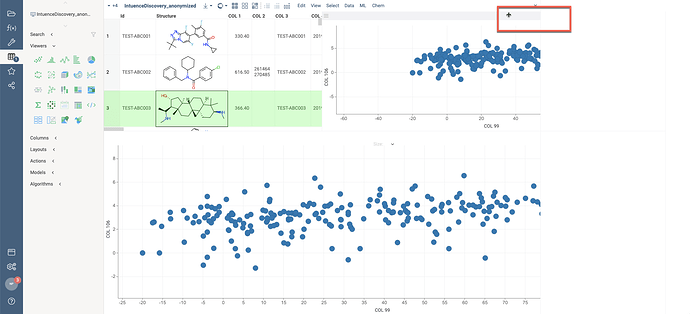
When dragging the scatterplots around, at some point they do no longer show the cog icon in the header bar:
I think the case is when you dock a root of the viewer instead of viewer itself.
Do not use dock(viewer.root), but dock(viewer), then the view will recognize it.
How do I as a user know what I’m docking?
Oh, I thought you were speaking about software-docked viewers.
Just checked, the cog icon never goes away if I dock-undock the viewer.
Could you provide steps to reproduce this?
@alex.paramonov, it appears that on the Nico’s picture both scatter plots extend to the right, and the rightmost part is covered by the white area - I’m not exactly sure what happened there, was it a result of the manual repositioning? @nico.pulver.novartis.com, any chance you can post a short video that reproduces the issue? Thanks!
I tried a couple of things, but I couldn’t reproduce it anymore
It’s related to the issue with scatterplot size, and now seems to be fixed
